Backtesting trading strategies becomes misleading when a historical sample is treated as proof instead of a test of rule behavior. A backtest applies defined strategy rules to past market data, then records how those rules would have behaved under the assumptions used in the test. The result can expose weaknesses, stress assumptions, and compare rule consistency, but it does not prove future performance.
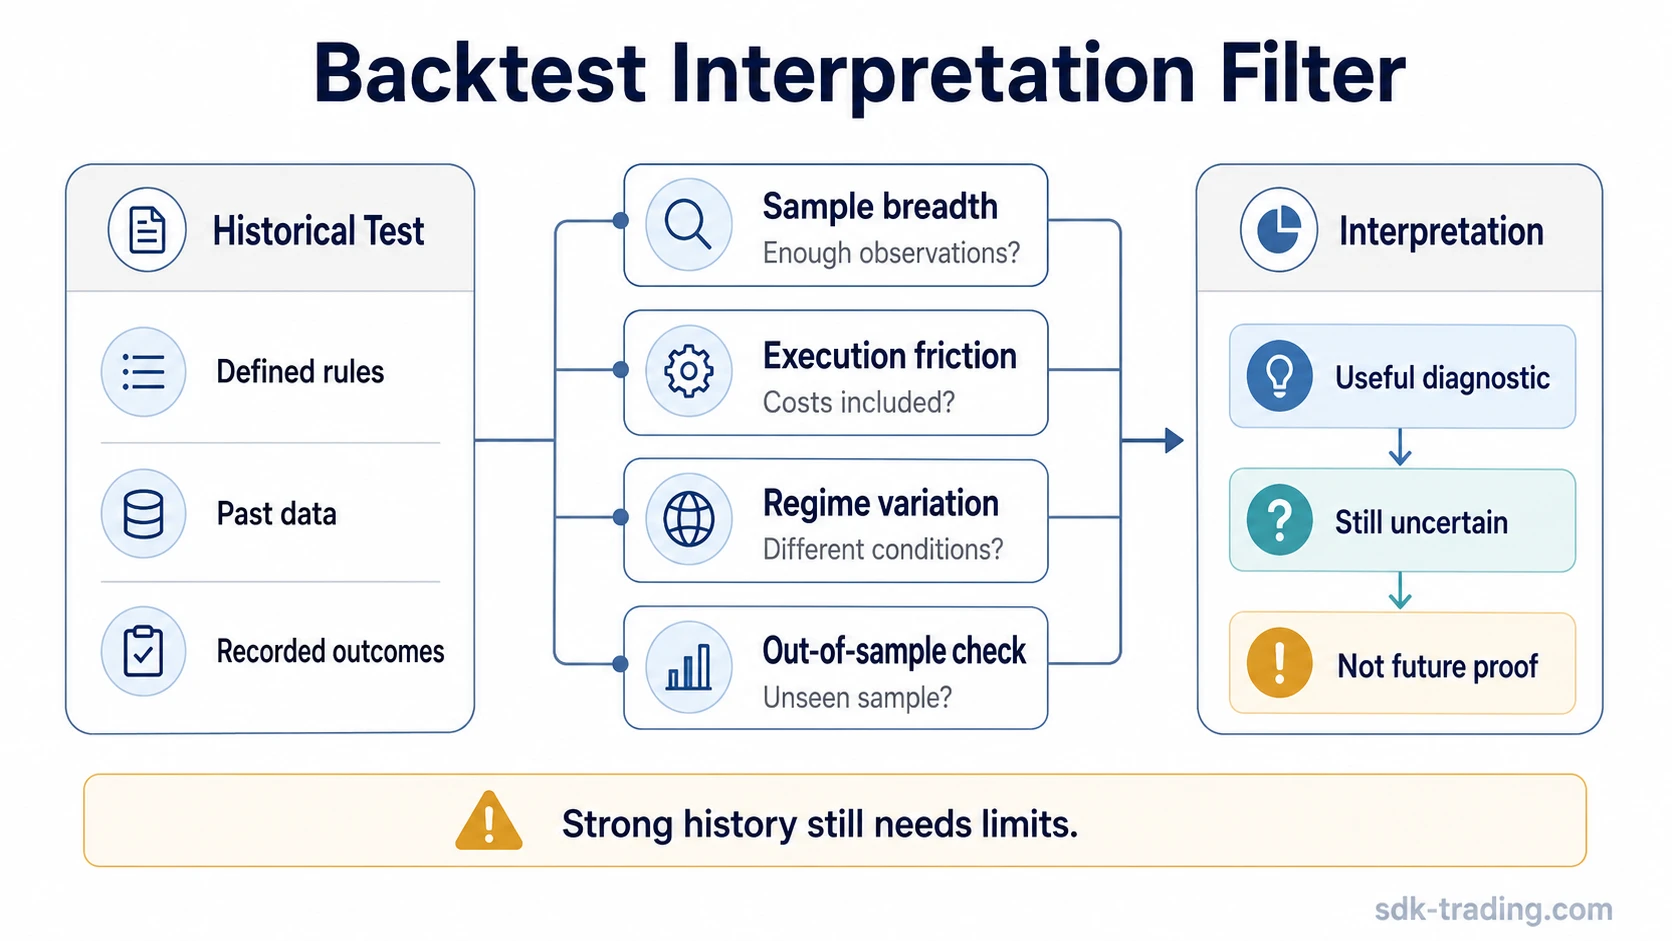
A useful backtest starts with a clear boundary: it is a historical diagnostic, not a prediction engine. Its value depends on whether the rules are specific, the data is realistic, the sample is broad enough, and the result is checked against costs, slippage, liquidity, and conditions outside the original test period.
Key Points
- Backtesting applies fixed trading strategy rules to historical data; it does not validate the future by itself.
- The result shows historical rule behavior under the assumptions used in the test.
- A strong historical result can still be weakened by sample bias, overfitting, poor data, or ignored execution friction.
- Backtesting is most useful when combined with out-of-sample checks, forward testing, and realistic cost assumptions.
What Backtesting Trading Strategies Means
Backtesting trading strategies means testing a defined set of trading rules against historical data to see how those rules would have behaved. The rules may describe market conditions, timing assumptions, risk boundaries, holding periods, or review criteria, but the test only measures what happened inside the selected historical sample.
The distinction matters because a backtest evaluates rule behavior, not trader certainty. A clean historical record may show that the rules were internally consistent during the test period, while still leaving open whether the same rules will behave similarly under different volatility, liquidity, trend, or execution conditions.
Working definition: Backtesting is a historical simulation that applies predefined strategy rules to past market data so the trader can review behavior, assumptions, and weaknesses before relying on those rules in unseen conditions.
How a Basic Backtest Works
A basic backtest should begin with rules that can be applied consistently. If the rules change during the test, the result becomes harder to interpret because the test is no longer measuring one stable idea.
- Define the rules. The strategy needs clear conditions so the same situation is handled the same way throughout the test.
- Select the market and timeframe. The test should match the type of behavior the rules are supposed to evaluate.
- Gather historical data. Data quality matters because missing prices, bad candles, adjusted data problems, or incomplete volume records can distort the result.
- Apply the rules consistently. Each historical signal must be handled under the same assumptions.
- Record outcomes. The record should include results, drawdowns, holding periods, exposure, and the number of observations.
- Review assumptions. Costs, spreads, slippage, liquidity, and execution delays should be considered where relevant.
- Validate beyond the original sample. A separate sample, forward test, or paper-trading period can show whether the rules still behave outside the data used to shape them.
The process can be done with spreadsheets, charting tools, code, or dedicated software. The tool is secondary to the quality of the rules, the realism of the assumptions, and the discipline of not reshaping the test until the past looks better.
What Backtesting Can Show
A backtest can show whether a strategy idea has internal structure. If the rules produce inconsistent results, depend on rare events, or only work during one narrow market condition, the historical record can reveal that before the idea is treated as durable.
Backtesting can also show whether the holding period, trade frequency, drawdown profile, and exposure level match the intended strategy style. For example, a swing trading approach usually needs assumptions that fit multi-day or multi-week holding periods, not assumptions borrowed from very short-term execution models.
The useful question is not only whether the historical result was positive. A better question is whether the result remained understandable after different market conditions, realistic costs, weaker periods, and adverse sequences were reviewed.
What Backtesting Cannot Prove
Backtesting cannot prove that a trading strategy will work in the future. Historical data is fixed, but future market behavior is not. A strategy can fit one period well and then weaken when volatility changes, liquidity changes, participation shifts, or the tested market enters a different regime.
A backtest also cannot fully reproduce live execution. Historical fills, spreads, delays, liquidity, and order behavior may look cleaner in a test than they would have been under real conditions. The more a strategy depends on precision, speed, or thin liquidity, the more cautious the interpretation should be.
Safe Interpretation
Treat a backtest as diagnostic evidence. It can expose weaknesses, compare assumptions, and reveal whether rules behaved coherently in the past. It should not be treated as confirmation that the same behavior will persist outside the tested sample.
Metrics to Review in a Backtest
Metrics are useful only when they are read together. A strong net historical result can hide deep drawdowns, unstable results, poor sample size, or dependence on a small number of unusual trades.
| Metric | What It Can Show | Why It Can Mislead |
|---|---|---|
| Net historical result | The total historical outcome under the test assumptions. | It can look strong even when the result depends on one rare period or ignores friction. |
| Drawdown | The depth of adverse periods during the test. | A small sample may understate how severe future drawdowns could become. |
| Win/loss ratio | The balance between positive and negative observations. | It says little without average gain, average loss, and drawdown context. |
| Average gain/loss | Whether larger outcomes offset smaller losses, or the reverse. | One extreme observation can distort the average. |
| Volatility | How unstable the result path was during the sample. | Low historical volatility may not survive a different market regime. |
| Exposure | How often the strategy was active during the test. | High exposure may hide concentration risk or sensitivity to one market condition. |
| Holding period | How long positions were typically held in the simulation. | Unrealistic holding assumptions can make the strategy look cleaner than it is. |
| Risk-adjusted return | Whether the historical result compensated for volatility or drawdown. | No risk-adjusted metric removes uncertainty or proves future durability. |
| Number of trades | Whether the sample has enough observations to review. | Too few trades can make the result highly sensitive to randomness. |
| Sample length | How many market conditions the rules were tested across. | A long sample can still be biased if it excludes difficult regimes. |
Backtesting Exit Rules Separately from Entry Rules
A strategy backtest becomes more useful when entry logic and exit logic are tested separately. The same entries can produce very different results depending on whether the exit uses a fixed take profit, partial exit, breakeven rule, trailing stop, or later technical exit.
In an internal 58-position review, the same closed-position sample was compared across several exit assumptions. The baseline exit used a later technical exit condition. Alternative models were then tested as final-R proxies to show how different exit rules would reshape the result distribution.
| Metric from the sample | Observed value | Why it matters in backtesting |
|---|---|---|
| Closed positions reviewed | 58 | The sample is useful, but still small enough that right-tail concentration must be checked. |
| Winning positions | 42 of 58 | Win rate was high, but win rate alone did not explain the result. |
| Losing positions | 16 of 58 | Losses were frequent enough to matter, but average loss size was much smaller than average winner size. |
| Average winner | 2.25R | Larger positive outcomes carried more importance than the raw win count. |
| Average loser | -0.28R | Small average losses helped the distribution, but did not remove the need to protect against larger adverse paths. |
| Top 5 winners | About 50% of net result | The result was meaningfully dependent on the right tail. |
| Top 10 winners | About 73.7% of net result | The backtest should check whether exit rules preserve or cut off large winners. |
The exit comparison produced a clear testing lesson. A full 2R exit kept the same directional win/loss classification in the proxy model, but reduced the net result index to 63.0. A 50% partial exit at 2R improved that to 77.4. A 30% partial exit at 2R improved it to 83.2. A full 5R exit reached 91.8. The baseline remained 100.0 because it allowed the largest winners to remain uncapped in the sample.
This is not a complete trailing-stop backtest because final R-multiple does not show the intratrade path. A proper trailing-stop test needs maximum favorable excursion, maximum adverse excursion, and step-by-step path data. Without those fields, the review can compare exit assumptions as a proxy, but it cannot confirm exactly where a trailing stop would have triggered.
Why Backtests Become Misleading
A backtest becomes weaker when the result is shaped around the past instead of tested against it. The most common problem is overfitting: adjusting rules, filters, or parameters until the historical result looks better, then mistaking that fit for durable evidence.
Sample bias creates a similar problem. A strategy tested only during a strong trending period may look stable because the selected market environment favored the rules. The same rules may behave differently during choppy, low-liquidity, high-volatility, or range-bound conditions.
| Stronger Backtest Evidence | Weaker Backtest Evidence |
|---|---|
| Rules tested across multiple market regimes | Rules fit one narrow historical period |
| Costs, spreads, and slippage included | Execution friction ignored |
| Out-of-sample check used | Same sample repeatedly optimized |
| Drawdown and adverse sequences reviewed | Profit-only review |
| Rule logic remains explainable | Parameters curve-fit to past data |
| Trade count and sample length are sufficient for review | Conclusion based on too few observations |
| Liquidity assumptions match the tested market | Thin-market fills treated as frictionless |
Common Backtesting Mistakes
The first mistake is judging a strategy from too few trades. A small sample may look clean because randomness has not had enough room to show weak periods, clustered losses, or unstable behavior.
The second mistake is ignoring transaction friction. Commissions, fees, spreads, slippage, liquidity, and execution delays can change the interpretation, especially when the strategy depends on frequent decisions or small price differences.
The third mistake is optimizing too tightly to the same historical sample. If rules are repeatedly adjusted after each test, the final result may describe the past sample more than the underlying strategy idea.
The fourth mistake is assuming one market condition generalizes to another. A test built during a trending period may not say much about sideways conditions. A result from a liquid large market may not transfer cleanly to a thinner market. A result from one volatility regime may weaken when volatility expands or contracts.
Illustrative Failure Mode
A strategy can appear strong when tested only during a narrow bullish period. The same rules may look weaker after a separate sample is used, after costs and slippage are included, or after the rules are tested during a market regime with less directional movement. The issue is not that the first test is useless. The issue is that the first test is incomplete.
Backtesting vs Forward Testing
Backtesting uses historical data. Forward testing checks whether the same rules behave under unseen or live-like conditions after the rules have already been defined. Paper trading is one form of forward testing when the rules are tracked without financial execution.
The distinction is important because a backtest can be shaped by the original data sample. Forward testing reduces dependence on that sample by asking whether the rules still behave when the future was not available during rule design.
Forward testing is not proof either. It may still be affected by market regime, sample size, execution assumptions, and trader behavior. Its role is to add another layer of evidence, not to remove uncertainty.
How to Read a Backtest Without Overtrusting It
A safer interpretation starts by asking what the backtest actually measured. Did it test stable rules, or did the rules keep changing? Did it include friction, or did it assume clean execution? Did it cover different market regimes, or only one favorable period? Did it survive an out-of-sample check, or only the data used to shape the idea?
The result becomes more useful when it is treated as evidence quality rather than proof. A backtest with weaker headline results but clear rules, realistic assumptions, and broad sample coverage may be more informative than a cleaner-looking result built from repeated optimization on one dataset.
Condition, Implication, Limitation
Condition: rules are tested on historical data with realistic assumptions.
Implication: the result can show how those rules behaved in the selected sample.
Limitation: the result cannot confirm that the same behavior will continue under future market conditions.
Backtesting Trading Strategies FAQ
Does backtesting prove a trading strategy works?
No. Backtesting shows how defined rules behaved on historical data under specific assumptions. It can support strategy evaluation, but it does not prove future performance.
What makes a backtest unreliable?
A backtest becomes less reliable when it uses poor data, too few trades, a narrow sample, repeated optimization on the same data, or assumptions that ignore costs, spreads, slippage, liquidity, and execution delays.
What is the difference between backtesting and forward testing?
Backtesting applies rules to historical data. Forward testing applies already-defined rules to new or live-like conditions, often through paper trading or later observation. Both are limited, but forward testing reduces dependence on the original historical sample.