Oscillators in trading are technical indicators that convert price, range, momentum, or price-plus-volume behavior into readings that move around a reference scale. The useful filter is not the word “oscillator” by itself, but which trading oscillator is being used and what its calculation is actually measuring.
Definition: Trading oscillators are chart indicators that measure price movement through a bounded scale, a zero line, a range-position formula, or a momentum baseline. They help classify momentum pressure, threshold behavior, and relative position, but each oscillator reads the market through a different calculation lens.
Key Points
- Trading oscillators do not all measure the same input. Some measure recent gains and losses, some measure range position, and others measure displacement from a baseline.
- A threshold reading means different things on a bounded oscillator, a zero-line oscillator, and a centered oscillator.
- The main choice is which oscillator matches the reader’s question: momentum strength, range position, volume participation, or overbought and oversold behavior.
- False readings often come from using one oscillator’s threshold logic on a different calculation type.
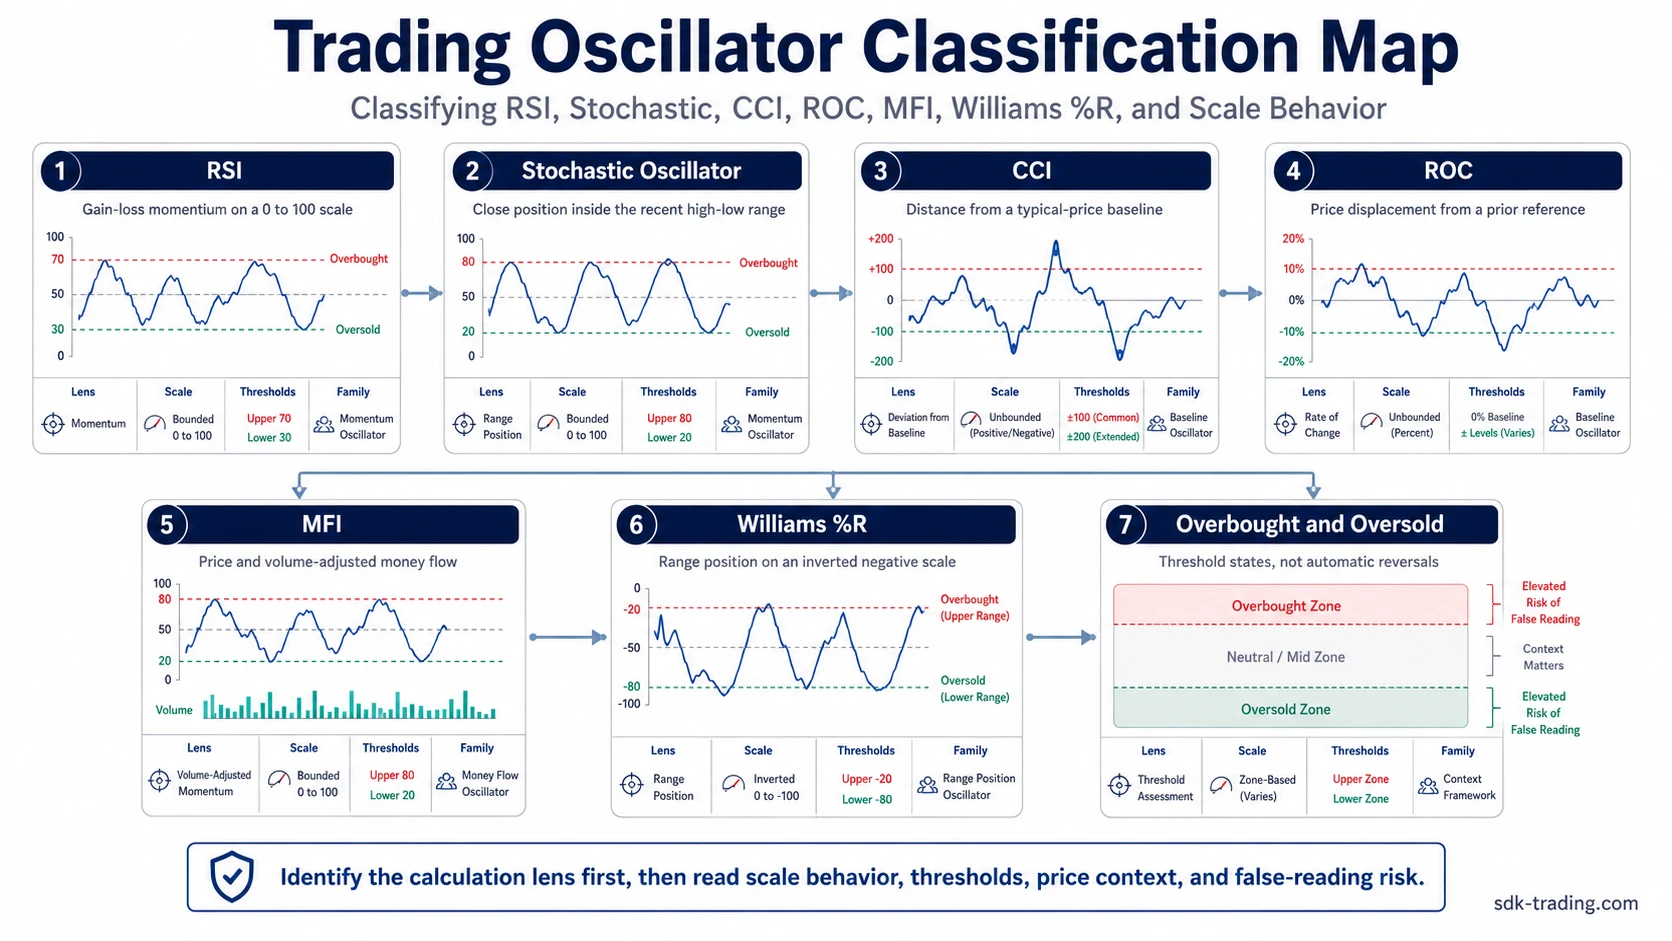
Trading Oscillator Choice Map
The fastest way to choose an oscillator is to identify the calculation input. A price-only momentum oscillator, a range-position oscillator, and a volume-adjusted oscillator can react differently to the same chart because they are not measuring the same thing.
| Reader question | Best route | Calculation boundary |
|---|---|---|
| How do recent gains and losses compare inside a bounded scale? | RSI indicator | Uses recent gain-loss behavior inside a 0 to 100 reading. |
| Where is the close relative to the recent high-low range? | Stochastic Oscillator | Focuses on range position rather than raw price change. |
| How does RSI behave when applied to stochastic-style movement? | Stochastic RSI | Applies stochastic logic to RSI values, creating a faster and more sensitive oscillator. |
| How far has price moved from an average baseline? | CCI indicator | Reads distance from a typical-price baseline rather than a fixed 0 to 100 range. |
| How much has price changed versus a past reference point? | ROC indicator | Measures percentage displacement from a lookback reference. |
| How does volume-adjusted money flow affect momentum? | MFI indicator | Combines price and volume-derived money flow inside a bounded reading. |
| Where does the close sit inside the recent range on an inverted scale? | Williams %R indicator | Uses range-position logic, but displays the reading through a negative scale. |
| How can multiple lookback windows be blended into one oscillator? | Ultimate Oscillator | Combines buying pressure and true range across several time windows. |
| How does a histogram-style oscillator compare shorter and longer momentum behavior? | Awesome Oscillator | Compares moving-average behavior and displays the difference as histogram momentum. |
| What do overbought and oversold readings mean across oscillator types? | Overbought and oversold readings | Clarifies threshold states without treating them as automatic reversal points. |
Why Oscillators Can Disagree
Oscillator disagreement usually comes from calculation design. RSI may rise because recent gains outweigh recent losses. Stochastic may stay high because price keeps closing near the upper part of its recent range. CCI may move sharply when typical price moves far from its baseline, while ROC may show only the size of displacement from a prior price.
Volume can change the reading again. MFI can react differently from a price-only oscillator because it includes money-flow behavior. A move with rising price but weaker participation may therefore look different on MFI than it does on RSI or ROC.
Oscillator reading check: Identify the input first: gain-loss balance, range position, baseline distance, percentage displacement, volume-adjusted flow, or blended lookback behavior. The threshold only has meaning after the calculation lens is clear.
Threshold and Scale Differences
A bounded oscillator and an unbounded oscillator should not be read with the same threshold habit. RSI, Stochastic, MFI, Williams %R, and Ultimate Oscillator use bounded scales. CCI and ROC behave differently because their readings can expand beyond fixed upper and lower bands.
This is why threshold language needs a specific reference. A high RSI reading, a high Stochastic reading, and an extended CCI reading may all describe strength, but each one reaches that state through a different formula. The reading becomes weaker when the threshold is copied from one oscillator type to another without checking scale behavior.
| Oscillator type | What the reading often reflects | Common misread |
|---|---|---|
| Bounded 0 to 100 tools | Position inside a fixed reading range. | Assuming a high or low reading must reverse immediately. |
| Centered or zero-line tools | Movement above or below a baseline. | Reading baseline distance as if it were the same as an RSI threshold. |
| Range-position tools | Where price closes relative to a recent high-low range. | Confusing range position with trend strength by itself. |
| Volume-adjusted tools | Price movement with participation behavior included. | Comparing the reading directly with price-only oscillators. |
Related Oscillator Comparisons and Frameworks
Oscillator analysis often requires separating the indicator’s calculation from its interpretation. Some questions are about how one oscillator measures momentum or range position, while others compare threshold behavior, divergence, signal timing, or how oscillator readings fit into a broader market-reading process.
| Reader problem | Best route | Use when |
|---|---|---|
| RSI and CCI appear to describe different momentum conditions. | CCI vs RSI | The question is about bounded gain-loss momentum versus baseline-distance behavior. |
| RSI and Stochastic give different threshold readings. | RSI vs Stochastic Oscillator | The issue is recent gain-loss balance versus close position inside the recent range. |
| The reader needs the broader momentum-indicator family. | Momentum indicators explained | The question includes oscillator tools but is wider than oscillator classification alone. |
| The reader needs a qualified trading overview of oscillator use. | Oscillators for trading guide | The question is about how oscillator readings fit into a trading workflow. |
| The reader is comparing high and low threshold states. | Overbought vs oversold explained | The issue is threshold meaning rather than one specific oscillator. |
| The reader wants a framework built around RSI behavior. | RSI strategy framework | The question has moved from oscillator definition into conditional interpretation. |
How to Read Trading Oscillators
Start with the oscillator’s calculation, then read its scale. A 0 to 100 reading, a zero-line reading, a negative range-position reading, and a histogram reading do not carry the same implication just because they all belong to the oscillator family.
Then compare the reading with price behavior. The oscillator is cleaner when its formula, threshold behavior, and price structure point toward the same interpretation. The reading is weaker when the tool is sensitive to noise, the lookback window is mismatched to the chart, or the threshold is borrowed from another oscillator type.
When Oscillator Readings Need Caution
Oscillator readings become weaker when the chosen tool is too sensitive for the chart structure, when the lookback window does not match the trading horizon, or when threshold logic is copied from a different oscillator family.
A bounded momentum reading, a range-position reading, a zero-line reading, and a histogram reading can all describe momentum, but they do not define momentum through the same calculation. The cleaner interpretation starts with the formula before assigning meaning to the threshold.