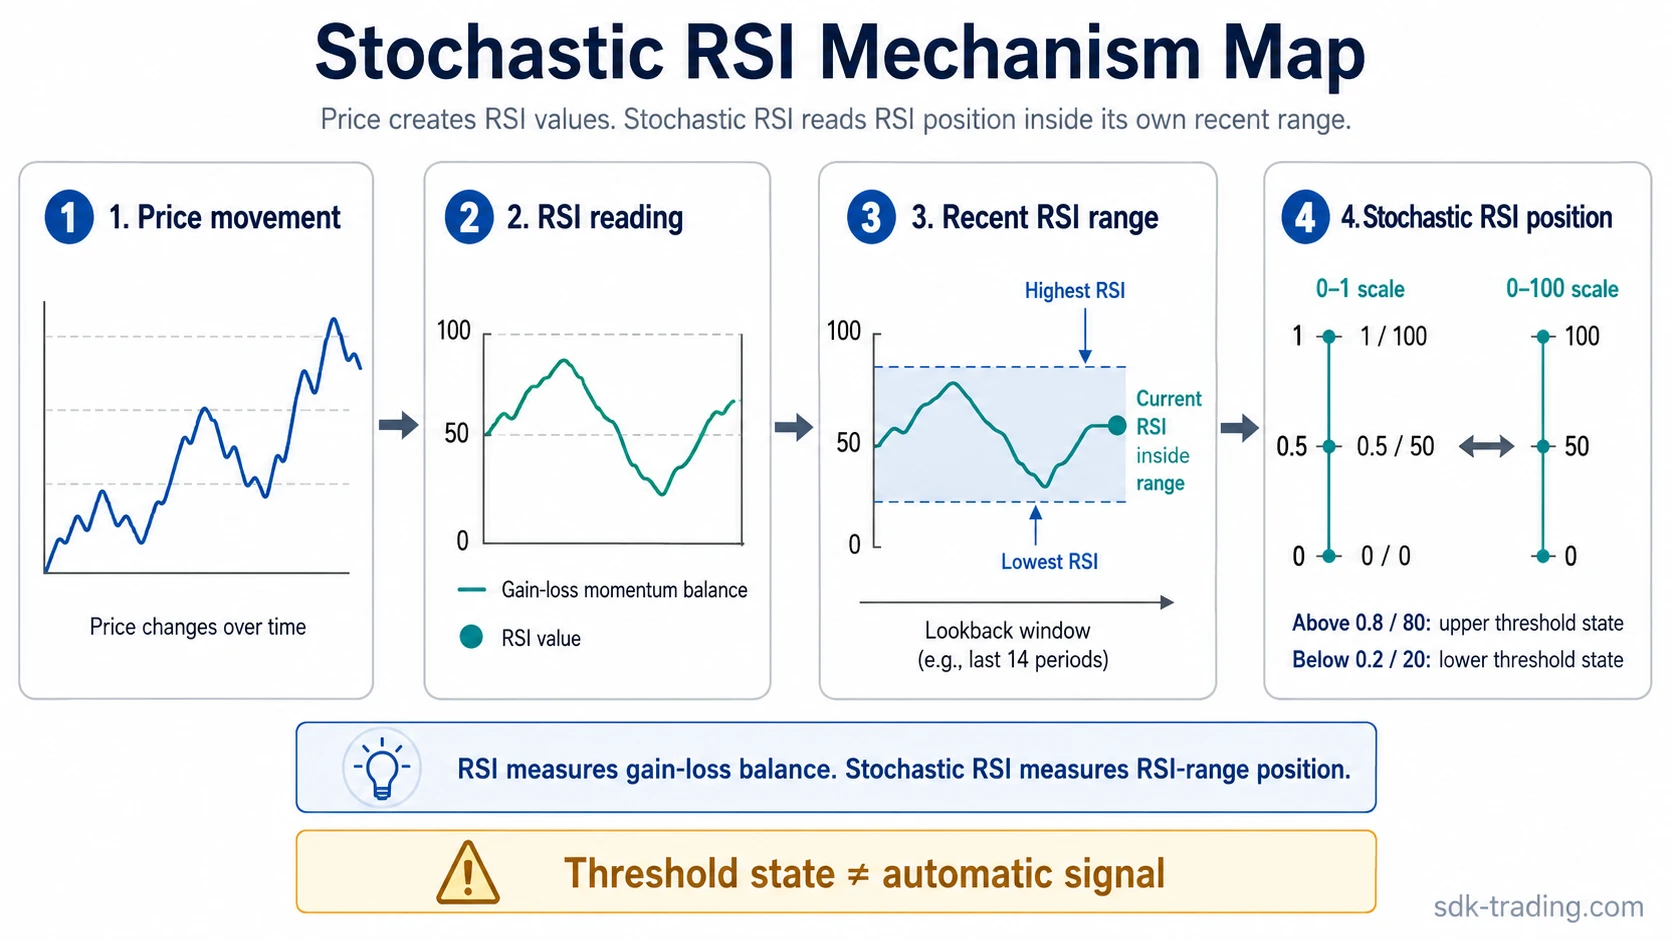
Stochastic RSI is a bounded oscillator that applies stochastic range logic to RSI values. Instead of measuring where price closes inside a recent high-low range, it measures where the current RSI reading sits inside its own recent RSI range. That makes Stochastic RSI an indicator of an indicator: it shows RSI position inside a lookback window, not raw price movement.
The useful boundary is simple: Stochastic RSI does not tell whether price is high or low in absolute terms. It tells whether RSI is near the upper, middle, or lower part of its recent RSI range. A high reading means RSI is near the top of that recent range. A low reading means RSI is near the bottom. The signal is more useful when it is checked against price behavior, trend condition, and whether the RSI range is expanding or compressed.
Key Points
- Stochastic RSI applies the stochastic formula to RSI values, not directly to price.
- The indicator shows where current RSI sits inside its recent RSI high-low range.
- Readings may appear on a 0-1 scale or a 0-100 scale depending on the charting platform.
- 80 and 20 are common threshold zones, not automatic reversal levels.
- Stochastic RSI is usually more sensitive than RSI because it normalizes RSI inside a recent RSI range.
- The oscillator state carries more weight when RSI behavior, price structure, and market context agree.
What Is Stochastic RSI?
Stochastic RSI is a technical oscillator that measures the position of the current RSI value within its recent RSI high-low range. It is commonly displayed as a bounded reading from 0 to 100, or from 0 to 1 on some platforms.
Stochastic RSI is often shortened to StochRSI. It was introduced by Tushar Chande and Stanley Kroll as a way to make RSI readings more sensitive to short-term changes. The indicator starts with RSI, then applies stochastic range logic to those RSI values.
This creates a different measurement from standard RSI. RSI compares recent gains with recent losses. Stochastic RSI compares the current RSI value with the highest and lowest RSI values inside a selected lookback period.
The result is a faster oscillator that can reach upper and lower threshold zones more frequently than RSI. That sensitivity can help show short-term shifts in RSI behavior, but it can also create false-positive readings when the RSI range is narrow or the market is noisy.
How Stochastic RSI Works
Stochastic RSI works by taking RSI values and measuring where the latest RSI reading sits inside a recent RSI range. The highest RSI and lowest RSI over the lookback period define the active range. The current RSI value is then placed inside that range.
If the current RSI value is close to the highest RSI in the lookback window, Stochastic RSI moves toward the upper boundary. If the current RSI value is close to the lowest RSI in the window, Stochastic RSI moves toward the lower boundary. If RSI is near the middle of its recent range, Stochastic RSI moves closer to the center of the scale.
Mechanism note: Stochastic RSI is strongest as an RSI-range-position tool. It becomes more fragile when RSI is compressed, when price is choppy, or when a strong trend keeps oscillator readings near one boundary.
This is why Stochastic RSI can look more active than RSI itself. It is not necessarily finding stronger signals. It is showing how RSI is moving relative to its own recent high-low range.
Stochastic RSI Formula
The Stochastic RSI formula compares the current RSI value with the lowest and highest RSI values over a selected lookback period.
| Formula element | Meaning | Role in the reading |
|---|---|---|
| Current RSI | The latest RSI value. | Shows the current oscillator input being measured. |
| Lowest RSI | The lowest RSI value in the lookback window. | Defines the lower boundary of the recent RSI range. |
| Highest RSI | The highest RSI value in the lookback window. | Defines the upper boundary of the recent RSI range. |
| StochRSI value | The normalized position of current RSI inside that RSI range. | Creates the bounded 0-1 or 0-100 output. |
The standard formula is:
StochRSI = (Current RSI – Lowest RSI) / (Highest RSI – Lowest RSI)
When platforms display the indicator from 0 to 100, the result is multiplied by 100:
StochRSI 0-100 = StochRSI 0-1 x 100
The formula does not compare price directly with its high-low range. It compares RSI with its own RSI range. That distinction is the main reason Stochastic RSI should not be interpreted exactly like the stochastic oscillator or standard RSI.
How to Read Stochastic RSI Thresholds
Stochastic RSI readings are usually interpreted through the oscillator level, the relationship between any smoothed lines, and the surrounding market context. The level alone is not enough.
| Reading area | 0-100 scale | 0-1 scale | Safer interpretation |
|---|---|---|---|
| Upper area | Above 80 | Above 0.8 | RSI is near the upper end of its recent RSI range. The reading needs context before it can suggest exhaustion. |
| Middle area | Around 50 | Around 0.5 | RSI is near the middle of its recent RSI range. The oscillator is not showing an extreme range-position state. |
| Lower area | Below 20 | Below 0.2 | RSI is near the lower end of its recent RSI range. The reading does not automatically imply reversal. |
| Persistent extreme | Repeated readings above 80 or below 20 | Repeated readings above 0.8 or below 0.2 | The oscillator may be reflecting trend persistence or RSI-range pressure rather than a turning point. |
The 80 and 20 levels are common reference zones, not fixed market laws. A reading above 80 does not mean price must fall. A reading below 20 does not mean price must rise. The quality of the reading depends on whether RSI behavior and price structure confirm the same condition.
Why Stochastic RSI Moves Faster Than RSI
Stochastic RSI often moves faster than RSI because it measures RSI position inside a recent RSI range. This second layer of normalization can magnify small RSI shifts, especially when the recent RSI range is narrow.
For example, if RSI has been moving between 48 and 55, a move from 50 to 54 can push Stochastic RSI close to its upper area because RSI is near the top of that small range. The absolute RSI value may still be moderate, but Stochastic RSI can look stretched because it is reading local RSI position.
Sensitivity limitation: Stochastic RSI can react early, but it can also overstate minor movement when RSI is compressed. A fast threshold touch is not automatically more important than a slower RSI move.
%K, %D, and Smoothing Lines
Many platforms display Stochastic RSI with a %K line and a %D or smoothed line. The raw Stochastic RSI value may be smoothed to reduce noise, and the second line may show a moving average of that smoothed value.
| Line | What it usually represents | Interpretation limit |
|---|---|---|
| %K line | The Stochastic RSI value, sometimes after smoothing. | Can move quickly and flip near thresholds in choppy conditions. |
| %D or smoothed line | A moving average or smoother version of the Stochastic RSI line. | Can reduce noise but may lag when RSI behavior changes quickly. |
| Line cross | A change in the relationship between the faster and slower line. | Not enough by itself without price structure and trend context. |
A line cross can show a short-term shift in RSI-range position, but it does not prove that price has reversed. Crosses are more meaningful when they occur near a relevant threshold and when the underlying RSI and price structure support the same reading.
Stochastic RSI vs RSI
Stochastic RSI and RSI are related, but they do not measure the same thing. RSI is the input. Stochastic RSI is a second calculation applied to that input.
| Indicator | Direct input | Main measurement | Common interpretation risk |
|---|---|---|---|
| RSI | Recent gains and losses. | Momentum balance between upward and downward price movement. | Assuming 70 or 30 automatically means reversal. |
| Stochastic RSI | RSI values. | Current RSI position inside its recent RSI high-low range. | Assuming a fast 80 or 20 touch is stronger than it really is. |
RSI can remain moderate while Stochastic RSI moves toward an extreme if RSI is near the top or bottom of a small recent RSI range. That is why Stochastic RSI can look stretched even when RSI itself is not at a classic overbought or oversold level.
Stochastic RSI vs Stochastic Oscillator
Stochastic RSI and the stochastic oscillator share similar range logic, but the input is different. The stochastic oscillator measures where price closes inside a recent price high-low range. Stochastic RSI measures where RSI sits inside a recent RSI high-low range.
| Tool | Range being measured | What the reading means |
|---|---|---|
| Stochastic oscillator | Recent price high-low range. | Where the close sits inside that price range. |
| Stochastic RSI | Recent RSI high-low range. | Where the current RSI sits inside that RSI range. |
This difference matters because the same 0-100 display can hide two different measurements. One is price-range position. The other is RSI-range position.
When Stochastic RSI Is Most Useful
Stochastic RSI is most useful when the trader wants a more sensitive view of RSI behavior. It can help identify when RSI has moved toward the upper or lower edge of its own recent range before standard RSI reaches a classic threshold.
The indicator is usually easier to interpret in range-bound or rotational conditions where price structure gives clear reference areas. In those conditions, a stretched Stochastic RSI reading can be checked against support, resistance, failed continuation, or renewed acceptance.
Context note: Stochastic RSI works best as a secondary reading. It should help describe RSI behavior, not replace trend analysis, price structure, or risk control.
Common Misreads
The most common Stochastic RSI mistake is treating every threshold touch as a trade signal. Because the indicator is sensitive, it can move above 80 or below 20 often. That movement may reflect a small RSI shift inside a narrow range, not a major market turn.
| Misread | Why it happens | Safer reading |
|---|---|---|
| Above 80 means sell. | The upper threshold is mistaken for an automatic reversal signal. | Above 80 means RSI is near the top of its recent RSI range. Trend and price behavior still matter. |
| Below 20 means buy. | The lower threshold is mistaken for an automatic reversal signal. | Below 20 means RSI is near the bottom of its recent RSI range. It may persist in weak conditions. |
| Fast movement means strong signal. | Sensitivity is confused with reliability. | Fast movement can happen because the recent RSI range is narrow. |
| Line crosses are enough. | The line relationship is treated as complete confirmation. | A cross needs context from the threshold zone, RSI behavior, and price structure. |
Stochastic RSI Settings
Stochastic RSI settings usually include an RSI length, a stochastic lookback period, and optional smoothing settings for the displayed lines. Different platforms may use slightly different defaults, so the exact display can vary.
The setting choice changes sensitivity. A shorter lookback can make the oscillator react faster. A longer lookback can make it smoother. Extra smoothing can reduce flicker, but it can also delay the reading.
| Setting choice | Typical effect | Main trade-off |
|---|---|---|
| Shorter lookback | More frequent threshold touches and faster movement. | More false-positive readings in noisy or compressed conditions. |
| Longer lookback | Smoother readings and fewer threshold touches. | More delay when RSI behavior changes quickly. |
| Additional smoothing | Cleaner line behavior and fewer small flickers. | Lag and possible loss of early information. |
Settings should be treated as an observation choice, not as a universal solution. The same settings can behave differently in a quiet range, a high-volatility rotation, or a persistent trend.
Where Stochastic RSI Fits in Indicator Analysis
Stochastic RSI is best understood as a sensitivity layer around RSI. It can help show when RSI has moved toward the top or bottom of its own recent range, but it should not replace the broader reading of price structure, trend condition, volatility, and risk context.
The indicator is most useful when the reader needs to separate three questions:
| Question | Better tool or context | Why it matters |
|---|---|---|
| Is RSI near the top or bottom of its recent range? | Stochastic RSI | This is the indicator’s direct measurement job. |
| Is momentum pressure broadly stretched? | RSI and price behavior | Stochastic RSI alone may exaggerate local RSI movement. |
| Is price accepting or rejecting an area? | Price structure and closes | The oscillator does not confirm acceptance or rejection by itself. |
| Is the market ranging or trending? | Market context | The same threshold reading can mean different things in each condition. |
This keeps Stochastic RSI in its correct role. It can sharpen the view of RSI movement, but it does not turn a threshold reading into a complete market conclusion.
FAQ
What does Stochastic RSI measure?
Stochastic RSI measures where the current RSI value sits inside its recent RSI high-low range. It does not measure price position directly.
Is Stochastic RSI the same as RSI?
No. RSI measures recent gains compared with recent losses. Stochastic RSI measures the position of RSI inside a recent RSI range.
Is Stochastic RSI the same as the stochastic oscillator?
No. The stochastic oscillator measures closing price position inside a recent price high-low range. Stochastic RSI measures RSI position inside a recent RSI high-low range.
What do 80 and 20 mean on Stochastic RSI?
On a 0-100 scale, readings above 80 show RSI near the upper end of its recent RSI range. Readings below 20 show RSI near the lower end of that range. These are threshold zones, not automatic reversal levels.
Does Stochastic RSI give automatic trading signals?
No. Stochastic RSI threshold readings show where RSI sits inside its recent range. They need price behavior, trend condition, and RSI-range context before interpretation.