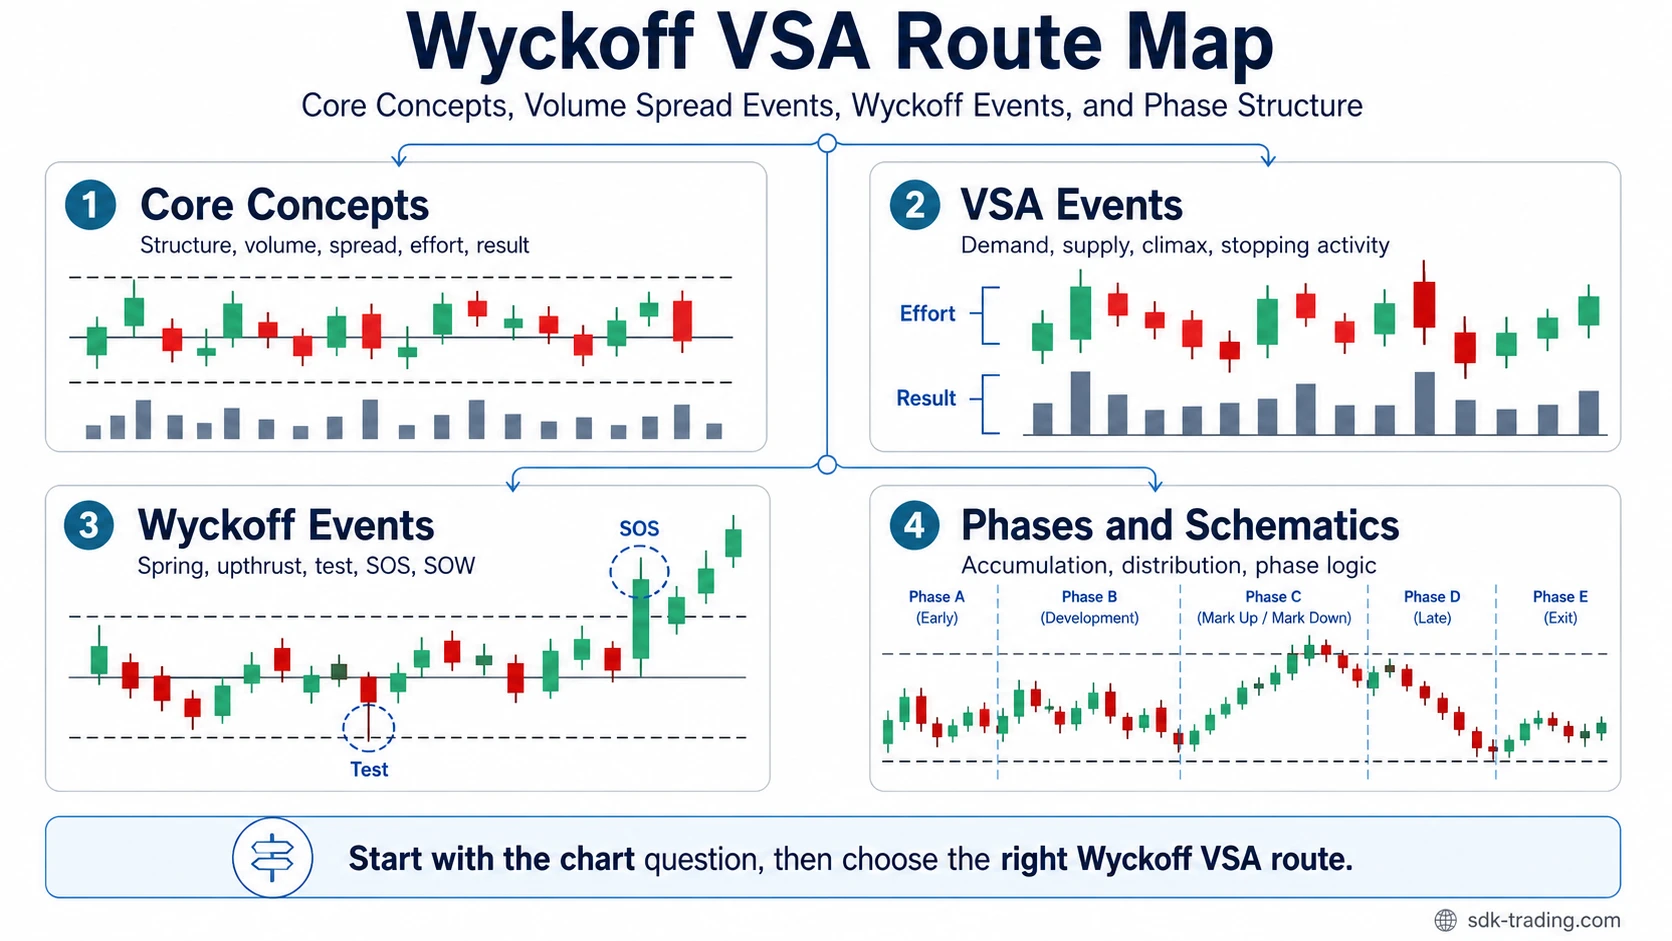
Wyckoff VSA brings together two related ways of reading price and volume. The Wyckoff Method organizes market behavior through supply and demand, cause and effect, effort versus result, trading-range events, and phase development. Volume Spread Analysis examines the relationship between volume, the price range of a bar, its close, and the result that follows.
Scope: This section separates four levels of analysis: foundational Wyckoff and VSA concepts, bar-level Volume Spread Analysis events, named Wyckoff events inside market structure, and broader accumulation or distribution phases and schematics.
How Wyckoff and Volume Spread Analysis Relate
Wyckoff and VSA overlap most clearly in their use of price and volume to study supply, demand, effort, and result. The difference is mainly one of analytical scale and terminology rather than a complete separation between structure and volume.
Wyckoff analysis can move from individual price-volume relationships to larger trading ranges, named events, accumulation or distribution phases, and the progression from cause to subsequent price movement. VSA places more emphasis on what an individual bar or short sequence reveals when volume is compared with the bar’s high-low range, closing location, and subsequent response.
| Analysis layer | Main evidence | Typical use |
|---|---|---|
| Wyckoff principles | Supply and demand, cause and effect, effort and result | Framework for interpreting price-volume behavior and market development |
| Volume Spread Analysis | Volume, bar range, closing location, and subsequent result | Closer examination of strength, weakness, stopping activity, and volume-spread conditions |
| Wyckoff events | Range location, price behavior, volume, and sequence | Classifying events such as springs, upthrusts, tests, and signs of strength or weakness |
| Wyckoff phases | Progression of multiple events across a trading range | Evaluating accumulation, distribution, and schematic development |
Choose the Right Level of Wyckoff VSA Analysis
The same chart can contain several layers at once. A high-volume bar may be worth examining through VSA without establishing a complete Wyckoff phase. A spring or upthrust requires a structural location inside a range. Accumulation or distribution requires a wider sequence of events rather than one isolated bar.
| What you need to identify | Section | Primary focus |
|---|---|---|
| How the Wyckoff Method, VSA, effort versus result, and price-volume analysis work | Core Concepts | The method-level principles behind the rest of the section |
| Whether volume, bar range, and closing behavior resemble a specific VSA condition | Volume Spread Analysis Events | No demand, climax behavior, stopping volume, and related event-level readings |
| Whether price is forming a named event at a specific location inside market structure | Wyckoff Events | Springs, upthrusts, tests, signs of strength, signs of weakness, and related structural events |
| How a trading range is developing across a larger sequence | Wyckoff Phases and Schematics | Accumulation, distribution, phase progression, and schematic structure |
Effort and Result Across Wyckoff VSA
Effort versus result provides a useful connection between the two approaches. In Wyckoff analysis, volume represents effort and price behavior represents result. A large increase in volume accompanied by strong directional price progress is different from the same volume producing little progress.
VSA narrows that comparison further by examining the bar’s range and where it closes. High volume on a wide bar that closes near one extreme has a different price-volume relationship from high volume on a narrow bar with limited directional progress.
Neither observation should be detached from location. The same volume and spread characteristics can carry different implications near the middle of an unresolved range, near a range boundary, or during an established trend.
Event Reading and Phase Reading Are Different Layers
A VSA condition describes relatively local price-volume behavior. A Wyckoff event adds structural location and sequence. A Wyckoff phase goes wider again by asking how several events fit together as a trading range develops.
| Observation | What it establishes | What it does not establish by itself |
|---|---|---|
| High volume on one bar | Unusually high trading activity | A buying or selling climax |
| Narrow price spread with particular volume behavior | An effort-result relationship worth examining | Absorption or lack of demand without surrounding evidence |
| Brief break beyond a trading-range boundary | A boundary test or excursion | A spring or upthrust without the required range context |
| Sideways trading range | A period of two-way trade | Accumulation or distribution without the broader event sequence |
A Practical Wyckoff VSA Reading Order
Start by locating the current price behavior within the broader chart: trend, trading range, range boundary, or transition area. Then compare volume with price progress. At the bar level, examine the high-low range and closing location. Only after those observations are established should a specific VSA or Wyckoff event label be applied.
- Background condition: Identify trend, trading range, or transition.
- Effort: Compare current volume with surrounding activity.
- Result: Measure how much directional price progress that effort produced.
- Spread and close: Examine the bar’s high-low range and where it finished.
- Event context: Check whether the behavior occurs at a location required by a named VSA or Wyckoff event.
- Phase context: If the question concerns accumulation or distribution, place the event inside the larger trading-range sequence.
Common Wyckoff VSA Classification Errors
| Classification error | Missing evidence |
|---|---|
| Calling any high-volume bar a climax | Spread, close, prior movement, and the price response associated with climax behavior |
| Calling every low-volume narrow bar no demand | Background weakness, bar relationship, and the appropriate subsequent response |
| Calling any failed breakout a spring or upthrust | Correct trading-range boundary, event sequence, and return into the range |
| Calling every sideways range accumulation or distribution | A coherent progression of price-volume events across the range |
| Treating one VSA event as a complete Wyckoff schematic | The wider phase structure in which individual events occur |