Chart patterns help organize recurring trading structures by boundary behavior, swing sequence, compression, and location on the chart.
The useful starting point is not the pattern name alone. A structure first needs to be sorted by what price is doing: reversing from a prior move, continuing after consolidation, compressing between converging boundaries, expanding into wider swings, or respecting a channel or trendline.
A chart pattern is a multi-swing price structure built from repeated interaction with trendlines, support, resistance, or a recognizable range. The pattern name is the surface label; the structure underneath determines whether the reading is clear enough to classify.
Definition: In trading, chart patterns are multi-candle or multi-swing formations that traders use to classify market structure, not standalone predictions of future price movement.
Key Points
- Start with structure: boundaries, swing sequence, compression, support, resistance, and location.
- Separate chart patterns from candlestick patterns before choosing a family.
- Use the main pattern families as classification routes, not as automatic trading signals.
- A visible shape is weaker when boundaries are forced, swing points are selective, or later price behavior fails to respect the structure.
Chart Patterns as a Structure Map
Chart-pattern analysis begins with how price organizes itself over several swings. A single candle may reveal rejection or momentum, but a chart pattern needs repeated price behavior across a broader structure.
The main questions are structural. Are the highs and lows compressing, expanding, flattening, or moving inside a channel? Is price reacting to the same boundary more than once? Does the structure appear after a trend, inside a pause, or around a prior support or resistance area?
That sequence prevents the common mistake of naming the first recognizable shape too early. A pattern label becomes cleaner when the boundaries can be drawn without forcing them and later price action still respects the structure.
Choose the Right Chart-Pattern Family
The easiest way to classify chart patterns is to start from the reading problem. First identify what the structure is trying to express, then move into the pattern family that owns the deeper criteria.
| What the structure suggests | Pattern family to check | Classification focus |
|---|---|---|
| Price may be shifting away from the prior directional move. | Reversal patterns | Prior trend, failed continuation, boundary break, and later acceptance or rejection. |
| Price pauses before trying to extend the existing move. | Continuation patterns | Trend context, consolidation shape, compression quality, and whether the structure remains orderly. |
| Price compresses toward converging boundaries or one horizontal side. | Triangle patterns | Boundary slope, horizontal-side behavior, range contraction, and repeated reactions. |
| Price compresses along rising or falling converging boundaries. | Wedge patterns | Shared boundary direction, narrowing swing range, and whether the lines are forced or clean. |
| Price respects a rising, falling, or sideways path between repeated boundaries. | Channels and trendlines | Boundary respect, slope, parallel structure, and repeated interaction with the same path. |
| Swings become wider rather than narrower. | Broadening patterns | Expanding highs and lows, volatility expansion, and whether the structure remains classifiable. |
| Price forms a rounded base or consolidation with a smaller handle-like pause. | Cup and handle patterns | Base shape, handle depth, prior context, and whether the structure is too shallow or too forced. |
| Price forms a more complex expansion-and-contraction structure. | Diamonds and Wolfe waves | Complex boundary geometry, swing count, symmetry risk, and whether simpler labels fit better. |
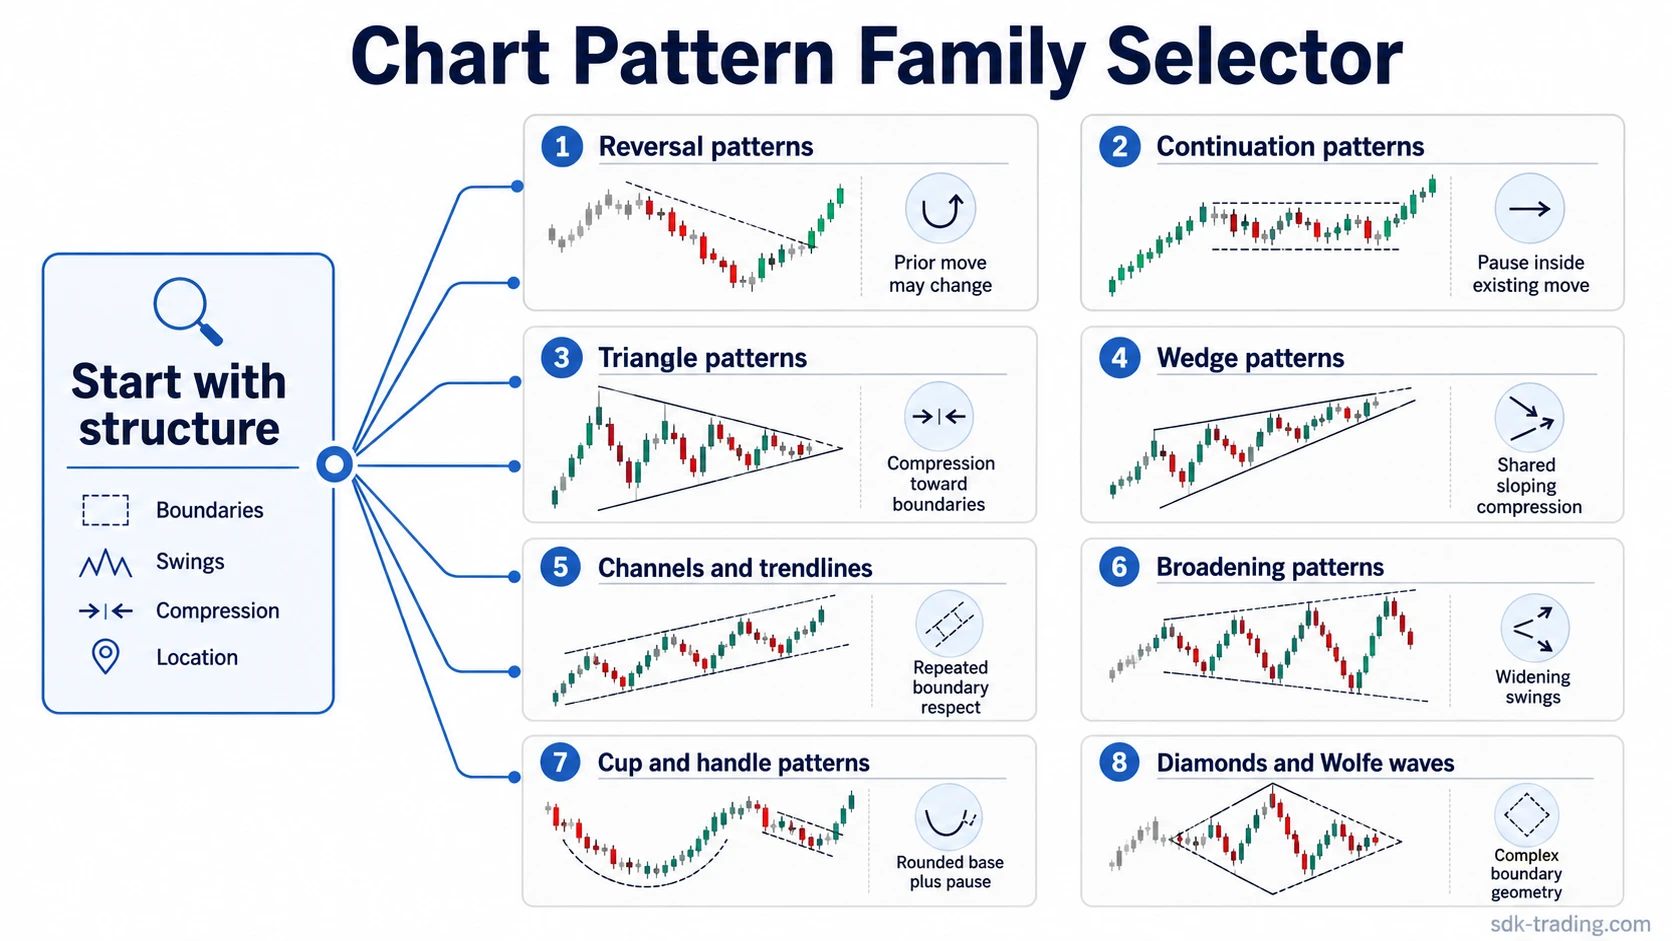
Chart Patterns vs Candlestick Patterns
Chart patterns and candlestick patterns belong to different reading layers. A chart pattern is built from several swings and usually needs boundaries, repeated tests, or a recognizable multi-candle structure. A candlestick pattern focuses on one candle or a small candle group.
This distinction matters when a search for a shape finds both chart structures and candle formations. A long wick, engulfing candle, or doji can affect interpretation inside a larger structure, but it does not automatically create a chart pattern by itself.
| Reading layer | Main unit | Typical question |
|---|---|---|
| Chart pattern | Several swings, boundaries, ranges, or trendlines. | What structure is price forming across the chart? |
| Candlestick pattern | One candle or a small candle group. | What does the candle behavior suggest at this location? |
What Makes a Pattern Reading More Defensible
A chart-pattern reading is more defensible when the structure can be identified without deleting inconvenient swings. Clean boundary interaction, repeated reactions, and a logical location on the chart matter more than a label that merely resembles a known pattern.
Context also changes the interpretation. A triangle inside an existing trend may be read differently from a similar triangle after an extended move into resistance. A wedge that compresses cleanly is different from a shape created by connecting only the most convenient highs and lows.
Limitation: Chart patterns do not prove direction by themselves. The reading remains conditional until later market behavior supports or weakens the classification.
Common Classification Mistakes
Most chart-pattern mistakes come from naming the shape before the structure is ready. A market can briefly resemble a triangle, wedge, channel, or broadening formation before enough swing points exist to classify it with confidence.
| Mistake | Why it weakens the reading | Safer check |
|---|---|---|
| Forcing boundaries through selective swing points. | The pattern exists only because inconvenient price behavior was ignored. | Check whether the same boundaries are respected by several meaningful reactions. |
| Naming the first visible shape too early. | The structure may still be an ordinary pause rather than a classifiable pattern. | Wait for enough swing development to separate compression, expansion, or channel behavior. |
| Mixing candlestick and chart-pattern logic. | A candle event may change tone, but it does not replace multi-swing structure. | Separate candle behavior from the larger boundary pattern before assigning a label. |
| Treating every boundary break as completion. | A break can fail, reverse, or remain unresolved if acceptance does not follow. | Compare the break with later acceptance, rejection, or failure to reclaim the area. |
For a narrower look at false positives and forced labels, chart pattern mistakes separates common classification errors from valid but imperfect structures.
Simple Chart Pattern Classification Example
Price compresses after an advance and the swing range begins to narrow. If both boundaries rise and converge, the wedge family is often the cleaner classification route. If the upper boundary is nearly horizontal while higher lows press toward it, the triangle family may fit better.
The example stays unresolved if the boundaries require selective drawing or if later price action stops respecting the structure. The practical distinction is classification quality, not a trading instruction.
Where to Go Next
Use the structure you see first. Compression, expansion, reversal context, continuation context, and boundary behavior should decide the next topic path before a pattern name is treated as useful.
If the main goal is to understand the mechanics before choosing a family, chart patterns explained clarifies how boundaries, swings, and context work together.
If the main goal is broad taxonomy rather than structure quality, types of chart patterns organizes the major groups without replacing the deeper family criteria.
FAQ
What are chart patterns in trading?
Chart patterns are multi-swing price structures that help classify how price is behaving around boundaries, support, resistance, compression, expansion, or trend continuation.
Are chart patterns the same as candlestick patterns?
No. Chart patterns usually require several swings or a broader price structure, while candlestick patterns focus on one candle or a small group of candles.
Which chart-pattern family should be checked first?
Start with the visible structure. Compression may point toward triangles or wedges, widening swings may point toward broadening formations, and context around a prior move may point toward reversal or continuation families.