Gap candlestick patterns are trading gaps where price opens away from the prior trading range, leaving a visible break between one price area and the next. The useful reading depends on gap type, market location, and later follow-through, not only on the open space itself.
Definition: A trading gap is a discontinuity between the prior price area and the next active price area. In candlestick analysis, the useful question is not only that a gap exists, but what type of gap it is, where it appears in the trend, and whether later price behavior treats the gap as expansion, continuation, exhaustion, isolation, or a fill candidate.
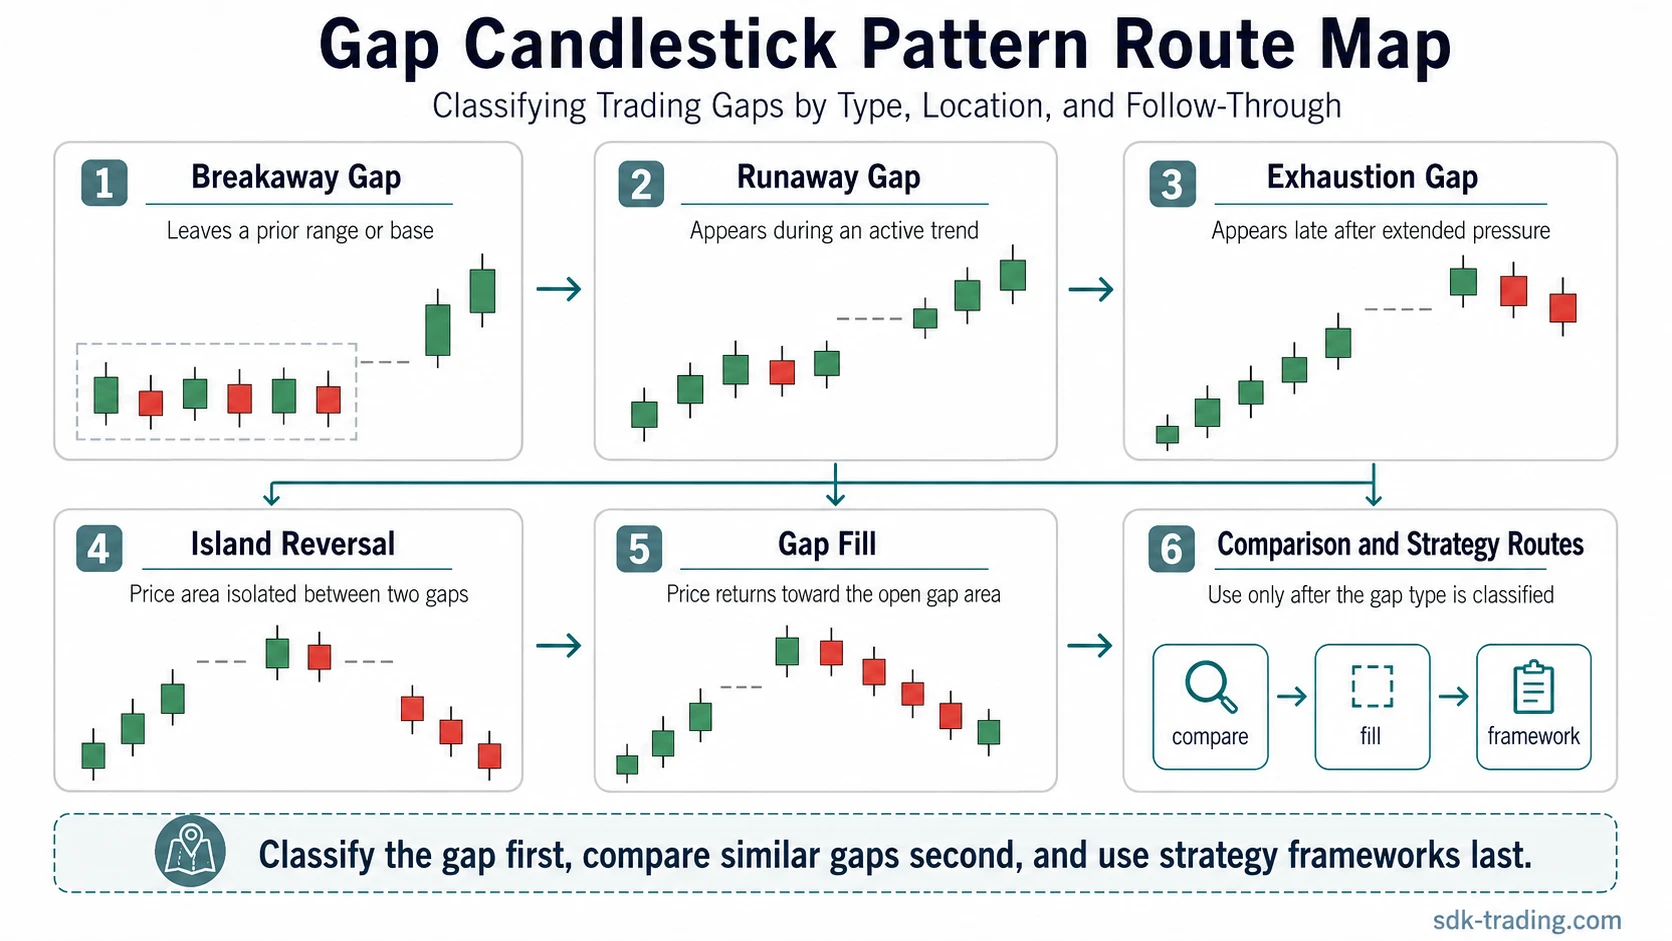
Gap classification depends on location and follow-through. A gap that appears near the start of a move, a gap that appears in the middle of an existing trend, and a gap that appears after an extended advance or decline should not be treated as the same structure.
Key Points
- Trading gaps are classified by where the price break appears and how later candles behave around it.
- Breakaway, runaway, exhaustion, and island reversal gaps belong to different interpretation paths.
- Gap fills and gap trading frameworks are support and strategy topics, not the same as defining a gap type.
- Gap analysis becomes weaker when every price space is treated as the same signal.
How Trading Gaps Are Classified
The first distinction is location. A gap near a prior base has different meaning from a gap inside an established move. A late gap after extended pressure can also behave differently from a continuation gap, even when the visual price space looks similar.
| Market condition | Relevant gap topic | Classification boundary |
|---|---|---|
| Price leaves a prior range, base, or congestion area. | Breakaway gap | Focuses on a gap that starts movement away from an old price area. |
| Price gaps while a directional move is already active. | Runaway gap | Focuses on continuation behavior inside an established trend. |
| Price gaps late after an extended move. | Exhaustion gap | Focuses on a late-stage gap where participation may be stretched. |
| Price gaps away, isolates a small price area, then gaps back. | Island reversal | Focuses on the isolated candle group between two gaps. |
| The broader stock-market meaning of gaps needs clarification. | Stock market gaps | Explains market-level gap behavior before narrowing into pattern types. |
| The main task is separating the major gap categories. | Types of gaps in trading | Organizes the main gap families without treating them as one setup. |
| Price returns toward the open space left by a prior gap. | Gap fill in stocks | Focuses on fill behavior rather than the original gap type alone. |
| Gap behavior is being organized into a conditional framework. | Gap trading strategy | Moves from classification into framework logic without replacing the gap type definitions. |
How Gap Patterns Differ from Nearby Candlestick Groups
Gap candlestick patterns are organized around discontinuous price movement. That makes them different from single-candle patterns, where the main object is one candle’s body and shadows, and different from double or triple candlestick patterns, where the relationship between adjacent candles is the primary structure.
Some continuation formations also include gaps, such as Tasuki-style structures, but the classification is different. When the price break itself is the main feature, the structure belongs with gap patterns. When the broader multi-candle continuation formation is the main feature, the continuation pattern family is the better fit.
Scope boundary: If the main question is what kind of gap appeared, classify the gap type first. If the main question is about a larger continuation formation that happens to contain a gap, classify the continuation structure instead.
Core Gap Types
The four core gap types are separated by trend location and follow-through. They should not be collapsed into one generic explanation because each one reflects a different stage of price movement.
| Gap type | Typical location | What to inspect next |
|---|---|---|
| Breakaway gap | Near a prior range, base, or congestion boundary. | Whether price accepts the break away from the old area. |
| Runaway gap | Inside an already active directional move. | Whether the gap extends the trend without immediate rejection. |
| Exhaustion gap | Late in an extended move after prior directional pressure. | Whether the gap fails to attract sustained follow-through. |
| Island reversal | A small price area is isolated between two gaps. | Whether the second gap traps the prior side of the market. |
When Gap Readings Become Weak
A gap reading becomes weaker when classification is based only on the visible price space. A large gap near the start of a move, a large gap in the middle of a trend, and a large gap after an extended run can require different interpretation paths.
The reading also weakens when the gap is treated as a direct trading instruction. Gap classification does not assign entries, exits, stops, targets, or prediction rules. It only separates the gap family and the market condition that makes the structure worth studying.
Common classification error: Calling every strong gap a breakaway gap ignores trend location. Calling every late gap an exhaustion gap ignores follow-through. Calling every return into a gap a gap-fill setup ignores why the gap formed first.
Gap Comparisons
Comparison pages help when two gap types look similar on the chart but point to different classification logic. The main distinction is usually location: early expansion, mid-trend continuation, late-stage stretch, or failed follow-through.
| Comparison problem | Relevant comparison | When it applies |
|---|---|---|
| The gap may be starting a move or appearing after the move is stretched. | Breakaway gap vs exhaustion gap | The confusion is early expansion versus late-stage extension. |
| The gap may be leaving a base or continuing a trend already in progress. | Breakaway gap vs runaway gap | The confusion is initial departure versus mid-trend continuation. |
| The gap may show continuation pressure or late exhaustion. | Runaway gap vs exhaustion gap | The confusion is trend continuation versus stretched participation. |
Practical Classification Sequence
Start with the gap’s location: beginning of a move, middle of a move, late in a move, isolated reversal area, or return into a prior open space. Then classify the structure from that location instead of applying one generic gap explanation to every chart.
Broad stock-market gap behavior, gap-type taxonomy, fill behavior, and strategy frameworks are separate layers. The safest interpretation sequence is classification first, comparison second, framework last.