Stock market gaps occur when a stock opens or trades away from the prior accepted price area, leaving visible space on the chart between the old area and the new one.
A gap up means the new trading area is above the prior area. A gap down means the new trading area is below it. Those labels describe direction only. They do not prove continuation, reversal, strength, weakness, or a required gap fill.
Definition: A stock market gap is a separation between a previous accepted price area and a later opening or trading area, usually visible because the chart interval did not trade through every intermediate price.
Key Points
- A stock market gap is a separation between a prior accepted area and a new opening or trading area.
- Gap up and gap down describe direction, not trade quality.
- A gap reading depends on location, catalyst, liquidity, volume, and later acceptance or rejection.
- Gap fills can happen, but they are not automatic.
What Are Stock Market Gaps?
Stock market gaps are visible spaces between one traded area and another. They often appear between sessions, especially when new information changes how buyers and sellers are willing to price the stock before the next regular open.
The important feature is not the blank space by itself. The important feature is the relocation of accepted price. The previous session may have ended with trading clustered in one area, while the next session begins in a different area because bids, offers, liquidity, and expectations changed before regular trading resumed.
The chart can show a gap even when no trades occurred at the intermediate prices during the interval being viewed. That does not mean price moved magically through empty space. It means the next available transactions or quotes formed away from the prior area.
Why Stock Market Gaps Happen
Gaps usually appear when information, liquidity, or positioning changes faster than the visible chart interval can show. Earnings releases, company news, analyst changes, sector repricing, broad index moves, and overnight macro developments can all shift where market participants are willing to transact.
Pre-market and after-hours activity can also change the next regular-session open. A stock may close near one area, trade thinly after hours, and open the next day at a different level because the order book has reset around new information.
Liquidity matters because a thin book can allow the next meaningful trade to print away from the prior close. A gap in a highly liquid stock after a major catalyst can carry a different meaning from a gap in a thinly traded stock where only limited participation is visible.
Gap Up vs Gap Down
Gap up and gap down are mechanical descriptions. They identify where the new price area opened or traded relative to the prior area, but they do not classify the quality of the move.
| Gap direction | What changed | What it does not prove |
|---|---|---|
| Gap up | The stock opens or trades above the prior accepted area. | It does not prove bullish continuation or a valid long setup. |
| Gap down | The stock opens or trades below the prior accepted area. | It does not prove bearish continuation or a valid short setup. |
| Partial gap | The open moves away from the prior close but may still overlap part of the prior range. | It does not carry the same structural weight as a clean separation without context. |
A clean directional gap can still fail. A small or overlapping gap can still matter if it appears at an important location and is followed by acceptance. Direction starts the classification, but later behavior decides whether the reading improves or weakens.
What a Stock Market Gap Does and Does Not Mean
A gap is best treated as a repricing event first. The market has moved from one accepted area to another, but the reason and quality still need to be judged.
Not this: every visible gap is a trade signal, continuation proof, reversal proof, or fill requirement.
Instead this: classify the gap by location, catalyst, liquidity, volume, and whether later trading accepts or rejects the new area.
A gap fill can occur when price later trades back into the blank area and revisits the prior range. That outcome is possible, but not required. Some gaps fill quickly, some fill later, and some remain open for long periods when the new area becomes accepted.
The safer interpretation is conditional. A gap becomes more meaningful when the new area holds, participation supports the move, and price does not immediately return into the prior accepted area. The reading weakens when the gap is rejected quickly, volume does not support the move, or the opening move appears after an already stretched advance or decline.
How to Read the Quality of a Gap
Gap quality depends on the behavior after the gap, not only on the empty space between candles. The first useful question is whether the market accepts the new area or rejects it back toward the old one.
| Reading quality | Typical evidence | Interpretation limit |
|---|---|---|
| Clean reading | The gap forms away from the prior area, holds the new area, and shows participation without immediate rejection. | The gap classification still needs separate risk and invalidation context. |
| Weak reading | The gap is small, overlaps prior price, lacks follow-through, or hesitates near the old area. | Direction alone may overstate the move. |
| Failed or rejected reading | Price quickly returns into the prior accepted area, or the new area is rejected before acceptance develops. | The initial classification loses force until new evidence appears. |
Volume can help, but volume alone is not enough. A high-volume gap into a poor location can still fail. A lower-volume gap can still matter if the new area holds and later candles confirm acceptance. The relationship between location, participation, and follow-through carries more weight than any single input.
Stock Market Gap Example in Context
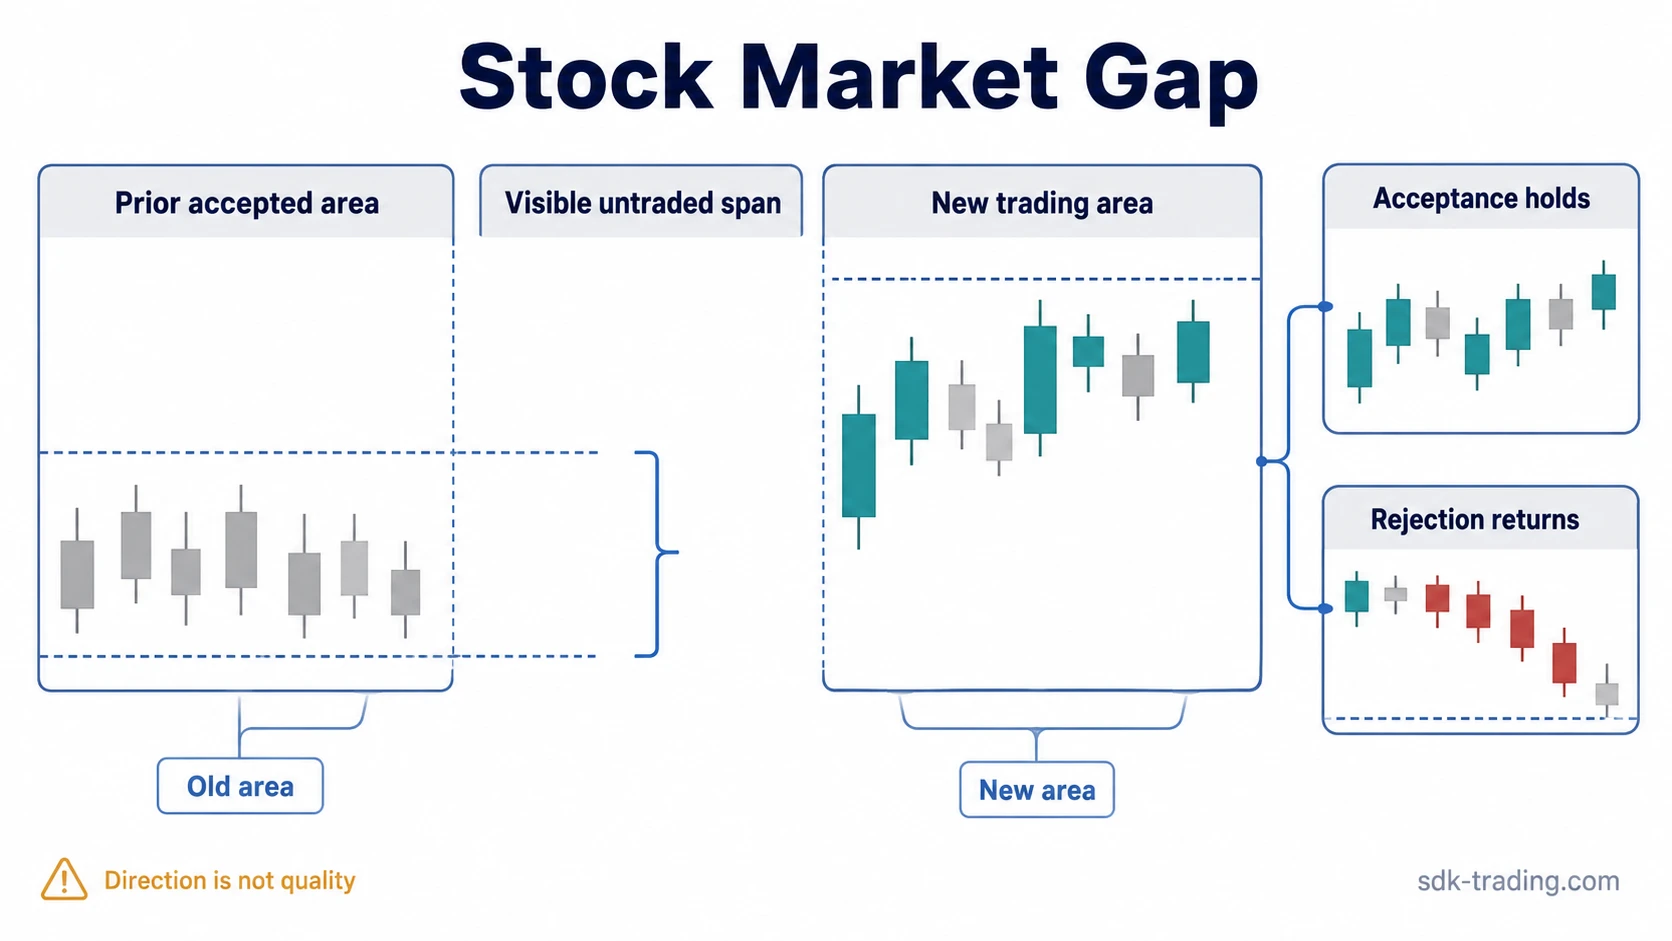
A stock closes inside a prior accepted range and opens the next session above that range after new information changes the order book. The chart shows visible untraded space because the regular-session interval did not trade through every intermediate price.
The gap looks constructive at first, but the reading remains unresolved. Acceptance improves if later candles hold above the old range and attempts to return into the prior area fail. Rejection becomes more important if price trades back into the old range and cannot reclaim the new area.
The same opening gap can carry different meaning in different locations. A gap away from a long base is different from a gap after an extended move. A gap that holds above a prior range is different from a gap that immediately fades back into that range.
How Stock Market Gaps Relate to Gap Types
Stock market gaps describe the broad mechanism. Gap types describe the structure around that mechanism.
A breakaway gap is usually read in relation to a prior base, range, or consolidation that price leaves behind. The focus is not only that price gapped, but that the gap appears as price separates from an older structure.
A runaway gap is usually associated with a move already in progress. The location matters because the gap appears after direction is established, not at the first break from a range.
An exhaustion gap is usually considered later in a mature move, especially when the gap fails to attract durable follow-through. The same visual separation can shift from strength to vulnerability when the move is already stretched and the new area is rejected.
An island reversal requires a more specific structure: price gaps away from one area, trades separately, and later gaps back, leaving an isolated price zone. That is narrower than a normal stock-market gap.
Common Mistakes With Stock Market Gaps
Assuming every gap must fill. Gap fills are possible, but the market is not required to revisit the gap before continuing, consolidating, or reversing.
Classifying by blank space alone. The space on the chart identifies the gap. Location, participation, and later acceptance decide whether the reading has quality.
Ignoring the prior accepted area. A gap away from a balanced range is different from a gap after a stretched move. The old area gives the gap its reference point.
Treating a screener list as interpretation. A screener can identify that a gap exists, but it cannot decide whether the new price area is accepted, rejected, or still unresolved.
Reading a Gap Without Overstating It
A stock market gap starts with repricing, but the interpretation remains conditional. The useful boundary is whether the new area becomes accepted, whether price returns into the prior area, and whether participation supports the change.
Without that sequence, the gap is only a visible repricing event, not a finished interpretation. The chart space identifies the event; the later response gives the event meaning.
FAQ
What are gaps in the stock market?
Gaps in the stock market are visible separations between a prior accepted price area and a later opening or trading area. The visible space appears because the chart interval did not trade through every intermediate price.
What is a gap up in the stock market?
A gap up occurs when a stock opens or trades above the prior accepted area. It describes upward separation, but it does not automatically prove continuation or trade quality.
Do stock market gaps always fill?
No. A gap may fill if price later trades back into the blank area, but that is not guaranteed. The chance of a fill depends on context, participation, liquidity, and whether the new area is accepted or rejected.
Why can price gap if no trades happened between levels?
Price can gap because the next available trades or quotes form away from the prior area. The chart interval may not show transactions at every intermediate price when the order book resets around a new level.