Supply and demand trading is a price-action way to read visible imbalance and directional pressure on a chart. The focus is not on proving who placed orders, but on how price behaved around a reference area, how strongly it left that area, and whether later behavior confirms or weakens the reading.
A supply or demand zone is a chart reference area created by prior price behavior. It is not a guaranteed reaction point. A useful reading depends on the sequence around the area: the pause before the move, the force of the departure, the quality of later acceptance or rejection, and the point where the interpretation no longer holds.
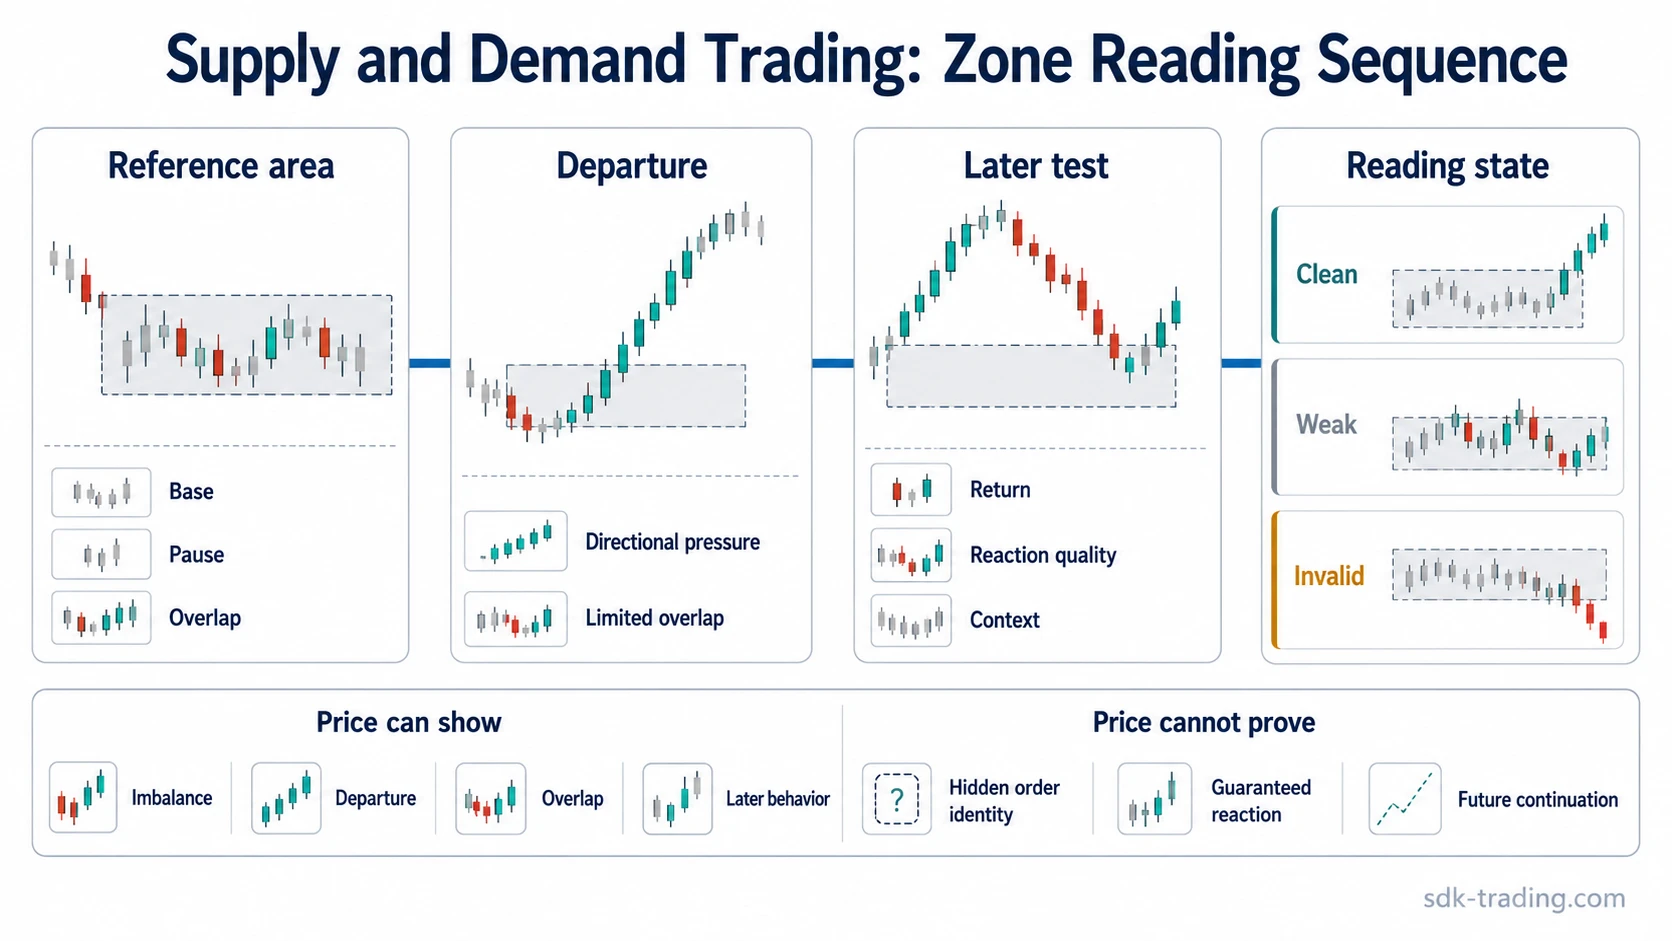
Core reading rules
- Supply and demand trading reads visible imbalance, not hidden order identity.
- A zone matters more when price leaves it with clear directional pressure.
- A first reaction is not enough; later behavior must support the interpretation.
- The reading weakens when price overlaps back into the area or cannot continue away from it.
- The concept is a chart-reading tool, not a complete decision process by itself.
What Supply and Demand Trading Means
Supply and demand trading looks for areas where price previously showed an imbalance between aggressive buying pressure and selling pressure. A demand area forms when price pauses or compresses, then moves higher with enough force to suggest that buying pressure dominated the next phase. A supply area forms when price pauses or compresses, then moves lower with enough force to suggest that selling pressure dominated the next phase.
The useful part is the observable behavior. Price may show that one side had enough pressure to move the market away from an area. Price does not prove that a specific institution, participant group, or hidden order pool caused the move. That boundary keeps the concept grounded in chart evidence instead of assumptions about unseen activity.
Supply and demand trading: a price-action method for reading imbalance through reference areas, directional departure, later acceptance or rejection, and failure conditions.
How Supply and Demand Zones Form
A supply or demand zone usually begins with a reference area where price pauses, compresses, overlaps, or builds a small base. The area becomes more meaningful only after price leaves it with clear directional movement. The departure is what turns a normal pause into a possible imbalance area.
The basic sequence is simple: price creates a reference area, leaves that area with directional pressure, later tests or respects the surrounding structure, and then either confirms, weakens, or invalidates the reading. A zone without later behavior remains only a possible reference point.
| Zone element | What it means | What weakens it |
|---|---|---|
| Reference area | A visible pause, base, compression, or overlap before the move. | The area is too wide, unclear, or drawn around random candles. |
| Departure | Price leaves the area with directional pressure and limited immediate overlap. | The move away is slow, choppy, or quickly retraced. |
| Later behavior | Price later respects, rejects, accepts, or overlaps the area. | Price returns deeply into the zone without a clear response. |
| Failure boundary | The point where the original imbalance reading no longer fits the visible behavior. | The boundary is vague, moved repeatedly, or ignored after price changes character. |
What Price Can and Cannot Reveal
Price can show imbalance through movement, distance, speed, overlap, and reaction quality. It can show whether a market moved away from a reference area with pressure, whether that pressure continued, and whether later trading respected or rejected the area.
Price cannot identify the exact orders behind the move. A strong departure from a zone may reflect aggressive participation, a thin area of liquidity, forced adjustment, short covering, broad repricing, or several factors at once. The chart can support an imbalance reading without proving the identity or intention of the participants behind it.
| Visible evidence | Reasonable interpretation | Unsupported leap |
|---|---|---|
| Strong move away from a base | Directional pressure appeared around that area. | Specific hidden orders are confirmed. |
| Limited overlap after departure | The move had cleaner control than a choppy move. | The zone must react again later. |
| Later rejection from the area | The area remains relevant under current conditions. | The next move is guaranteed to continue. |
| Deep overlap back into the area | The original imbalance reading is weakening. | The zone is still equally strong because it existed before. |
How to Identify Supply and Demand on a Chart
Identification starts with the behavior before and after the zone. A cleaner demand reading usually has a defined base, a strong upward departure, limited immediate return into the base, and later behavior that does not erase the original pressure. A cleaner supply reading has the same logic in the opposite direction: a defined base, a strong downward departure, and later behavior that does not quickly absorb the move.
The zone itself should not be stretched to include every nearby candle. A useful zone is a practical reference area around the price behavior that preceded the departure. When the area becomes too broad, the reading becomes less diagnostic because almost any later movement can be made to look like a reaction.
| Diagnostic question | Cleaner reading | Weaker reading |
|---|---|---|
| Was there a visible base? | Price paused or compressed before the directional move. | The zone is drawn after a random candle with no clear reference area. |
| Was the departure decisive? | Price moved away with clear direction and limited immediate overlap. | The move was slow, overlapping, or quickly absorbed. |
| Is the zone fresh enough to matter? | The area has not been repeatedly crossed or deeply consumed. | The area has been tested many times or traded through heavily. |
| Does structure support the area? | The zone sits near a meaningful swing, range edge, or prior imbalance area. | The zone is isolated from surrounding structure. |
| What happened after the first reaction? | Later behavior supports rejection, acceptance, or continuation. | Price reacts briefly, then overlaps back into the area without follow-through. |
Supply and Demand vs Support and Resistance
Supply and demand zones and classic levels can overlap, but they do not describe the same thing. A classic resistance level usually refers to an area where upward movement has previously struggled. Supply focuses more on the imbalance and downward departure that formed around an area.
A classic support level usually refers to an area where downward movement has previously struggled. Demand focuses more on the imbalance and upward departure that formed around an area.
| Concept | Main focus | Typical reading |
|---|---|---|
| Supply zone | Visible selling pressure after a base or pause. | Price previously left the area lower with directional pressure. |
| Demand zone | Visible buying pressure after a base or pause. | Price previously left the area higher with directional pressure. |
| Resistance | Area where upward movement has struggled. | Repeated reaction or rejection near a similar price area. |
| Support | Area where downward movement has struggled. | Repeated reaction or defense near a similar price area. |
Clean, Weak, and Invalid Supply and Demand Readings
The same zone can move through different states as new price behavior appears. A clean reading can become weak if price overlaps deeply into the area. A weak reading can become invalid if the market accepts beyond the zone and no longer behaves as if the original imbalance matters.
| Reading state | Visible behavior | Interpretation boundary |
|---|---|---|
| Clean | Defined base, strong departure, limited overlap, and later behavior that respects the area. | The imbalance reading remains supported by visible structure. |
| Weak | Departure is choppy, the zone is broad, or price returns deeply into the area. | The area may still matter, but the evidence is less clear. |
| Invalid | Price accepts through the zone and cannot reject or continue away from it. | The original imbalance reading no longer fits current behavior. |
A departure from a zone is only initial evidence. The reading becomes more useful when later behavior confirms acceptance or continuation, and it weakens when price overlaps back into the area or cannot follow through.
Common Mistakes When Reading Supply and Demand
The most common mistakes come from treating a zone as a fixed answer instead of a conditional reference. A cleaner approach is to start with the zone, then test whether the surrounding behavior still supports the imbalance reading.
| Mistake | Why it creates a problem | Cleaner reading |
|---|---|---|
| Drawing too many zones | Every pause starts to look meaningful. | Prioritize areas with clearer base, departure, and later behavior. |
| Treating every touch as meaningful | A simple touch does not confirm that imbalance remains active. | Watch whether price rejects, accepts, overlaps, or changes character around the area. |
| Ignoring stale zones | Repeated tests can consume or blur the original imbalance. | Give more weight to areas that have not been repeatedly crossed or deeply overlapped. |
| Assuming hidden order identity | The chart does not identify the participants behind the move. | Stay with visible pressure, departure quality, and later confirmation. |
| Using zones alone | A zone without context can create a false sense of precision. | Read the zone together with structure, acceptance, rejection, and failure conditions. |
Example of a Basic Supply and Demand Reading
A common scenario is a market that pauses in a narrow area after a decline, then moves higher with a strong directional candle sequence and limited immediate overlap. That pause can become a possible demand reference area because price showed visible buying pressure from that location.
The reading remains conditional. If price later returns to the area and rejects it with cleaner upward behavior, the demand interpretation becomes more defensible. If price overlaps through the area and stays below it, the earlier demand reading weakens or fails. The useful distinction is not the first departure alone, but the relationship between the departure, the later test, and the point where the original reading no longer fits.
Related Concepts
Supply and demand belongs inside price-action reading. It connects to structure, swings, range edges, acceptance, rejection, and failed continuation, but it should remain focused on imbalance behavior rather than every possible chart pattern.
| Concept | How it relates |
|---|---|
| Price action trading | The chart-reading framework that uses visible behavior rather than indicator-only interpretation. |
| Market structure | The surrounding swing and range context that can make a zone more or less meaningful. |
| Key reversal | A separate failed-continuation pattern around a prior extreme, not the same thing as a supply or demand zone. |
| Multi-timeframe context | A context layer that can change how a zone is interpreted, without replacing the visible imbalance reading. |
FAQ
What is supply and demand trading?
Supply and demand trading is a price-action method for reading visible imbalance around chart areas. It studies where price paused, how strongly it moved away, and whether later behavior confirms or weakens the original reading.
What is a supply zone?
A supply zone is a chart area where price previously showed selling pressure strong enough to move lower from a pause or base. The zone remains conditional and depends on later behavior around the area.
What is a demand zone?
A demand zone is a chart area where price previously showed buying pressure strong enough to move higher from a pause or base. The quality of the reading depends on the departure, context, and later response.
Are supply and demand zones guaranteed to work?
No. A zone is a reference area, not a guaranteed reaction point. The reading weakens when price overlaps deeply into the zone, accepts beyond it, or cannot continue away from it after a reaction. Chart zones can show visible imbalance and directional pressure, but they do not prove the identity of the orders or participants behind the move.