Price action core concepts are the basic chart-reading ideas traders use to classify levels, reactions, pressure, imbalance, and reversal behavior before adding strategy rules, confirmation conditions, or risk boundaries. They help organize what price is doing, but they do not decide whether a trade is valid by themselves.
Definition: price action core concepts are the foundational market-structure ideas used to read price movement directly from the chart. The main concepts in this group are support, resistance, supply and demand, and key reversal behavior.
Price action sits inside technical analysis as a chart-reading lens. It focuses on how price behaves around levels, ranges, swings, breakouts, failed breakouts, and reaction areas. It does not replace the full technical analysis process, and it does not remove the need for context, confirmation, invalidation, or risk control.
What Price Action Core Concepts Mean
Core concepts in price action give structure to chart observation. Without them, price movement can look like a random sequence of candles, swings, and reactions. With them, the chart can be separated into areas where buyers previously responded, areas where sellers previously responded, zones where pressure changed, and moments where a reversal reading may become more relevant.
A price action concept helps organize what the chart is showing. It does not by itself define confirmation, risk, execution, position sizing, or whether a setup deserves attention. A level can matter and still fail. A reversal label can appear and still need later evidence. A supply or demand area can describe pressure without becoming a complete strategy.
Core boundary: concept recognition comes before strategy logic. A trader may identify support, resistance, supply, demand, or key reversal behavior, but the interpretation remains incomplete until context, confirmation, invalidation, and risk boundaries are defined separately.
The Main Price Action Concepts
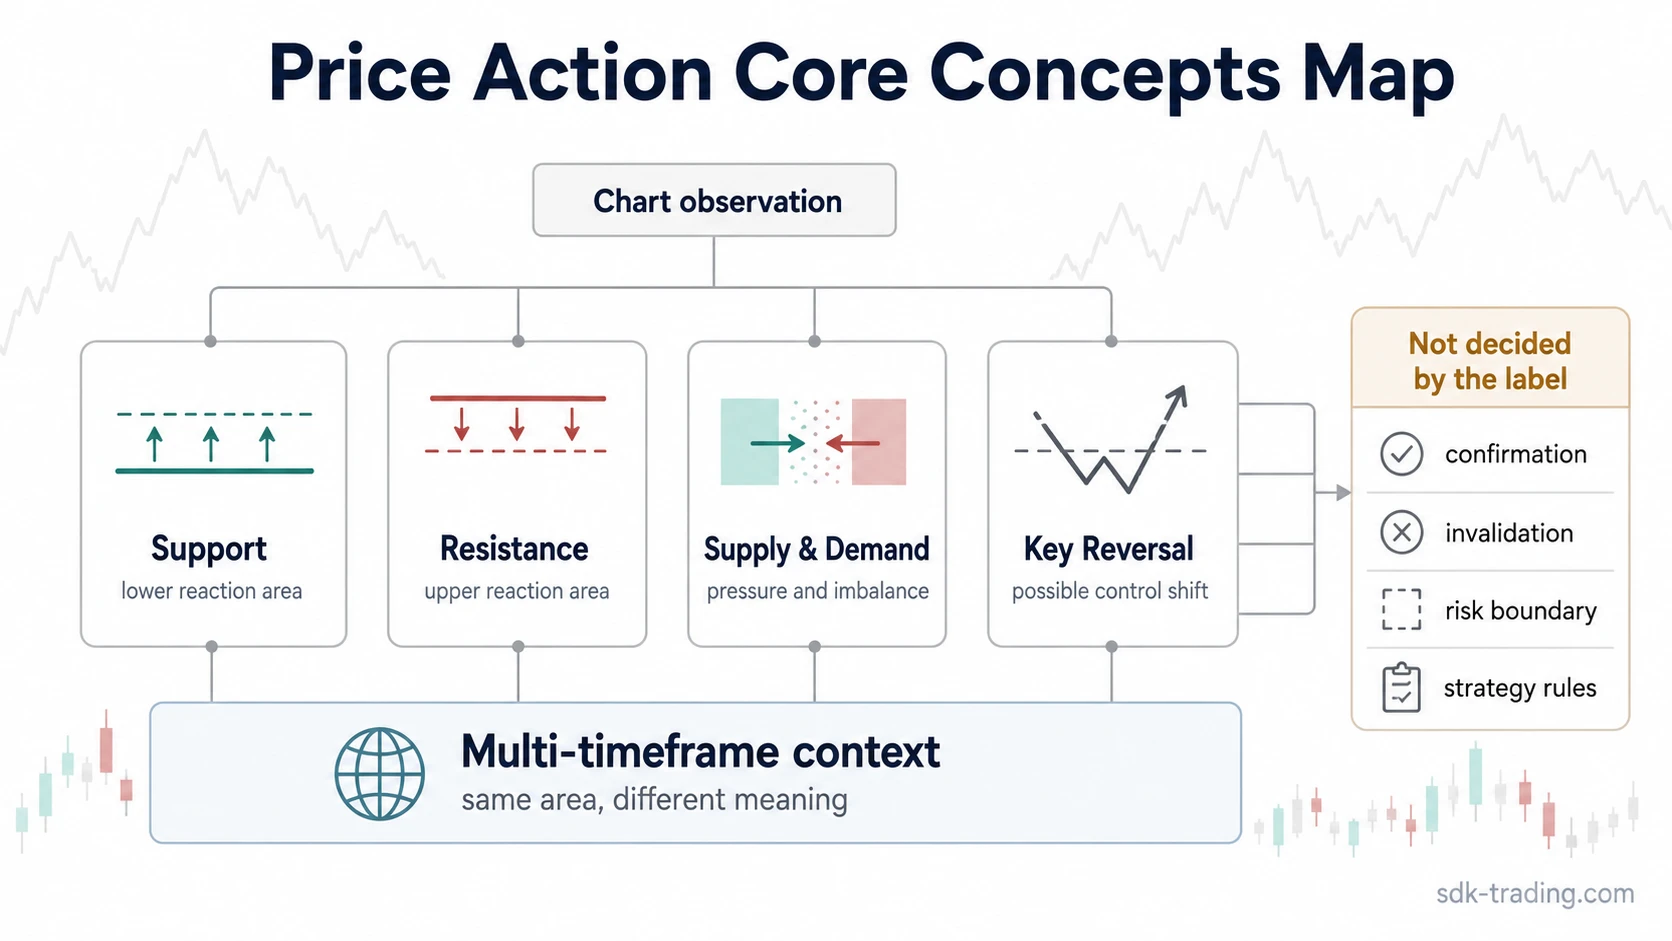
The central price action concepts are not interchangeable. Each one answers a different chart-reading question. Support and resistance describe reaction areas. Supply and demand describe pressure and imbalance. Key reversal describes a possible change in directional behavior that still needs context.
| Concept | What it classifies | What to study next |
|---|---|---|
| Support | A price area where downside movement previously met demand-side response or slower selling pressure. | Use support to understand where reaction areas may form, not as a fixed floor. |
| Resistance | A price area where upside movement previously met supply-side response or slower buying pressure. | Use resistance to understand where upside reactions may stall, not as a fixed ceiling. |
| Supply and demand | Pressure, imbalance, and participation shifts behind price movement. | Use supply and demand to separate reaction levels from pressure zones. |
| Key reversal | A reversal-reading condition where price behavior suggests a possible change in control. | Use key reversal as a context-dependent reversal concept, not as a prediction label. |
These concepts are strongest when they work together without being collapsed into one meaning. Support is not automatically demand. Resistance is not automatically supply. A reversal label is not automatically confirmation. The practical value comes from knowing which question each concept answers.
How These Concepts Fit Together
Support and resistance usually start with visible reaction areas. A previous low, range boundary, swing point, or rejected area can become a reference point for later observation. The level matters because price has responded there before, but the later reaction still needs to be judged by acceptance, rejection, volatility, participation, and follow-through.
Supply and demand add a pressure lens. A chart may revisit an old reaction area, but the more important question may be whether buying or selling pressure is expanding, fading, or being absorbed. That is why support vs supply and demand should be separated clearly instead of treated as different names for the same idea.
Key reversal belongs later in the reading sequence. A reversal interpretation becomes more defensible when price behavior around a level changes in a way that shows failed continuation, stronger counter-pressure, or a shift in control. The label is weaker when it is read from one candle or one reaction without surrounding structure.
Practical sequence: first identify the reaction area, then check whether the reaction reflects level response, pressure imbalance, or reversal behavior. A support test, a demand reaction, and a key reversal reading can occur near the same area, but they answer different questions.
Multi-timeframe analysis can change the interpretation because a level that looks important on one timeframe may be minor on another. The same price zone may act as short-term resistance inside a larger demand area, so timeframe context should stay attached to the reading.
What These Concepts Do Not Decide
Price action concepts classify chart behavior. They do not create a complete trading strategy. A strategy needs rules for market context, setup selection, confirmation, invalidation, risk boundary, position sizing, and review criteria. Without those parts, a concept label can become a vague explanation attached to any later price movement.
Common mistake: treating a support level, resistance level, supply zone, demand zone, or reversal label as a complete decision. The concept may describe what is visible, but it does not decide timing, risk, or trade quality.
Price action trading requires a broader decision framework than concept recognition alone. A trader still needs to define which conditions matter before the reaction, which evidence confirms or weakens the idea, and where the original interpretation becomes invalid.
Support and resistance trading strategy belongs to the strategy layer of the process. Support and resistance can identify reference areas, but the strategy question begins only after rules for context, confirmation, risk, and invalidation are added.
Where To Go Next
Choose the next concept by the chart-reading problem, not by the most familiar label.
| Chart-reading problem | Best next concept | Why it fits |
|---|---|---|
| Price keeps reacting near a lower area. | Support | Support helps classify downside reaction areas and whether sellers are still making progress. |
| Price keeps stalling near an upper area. | Resistance | Resistance helps classify upside reaction areas and whether buyers are losing progress. |
| The important issue is pressure, imbalance, or absorption. | Supply and demand | Supply and demand focus on participation and pressure rather than only visible level response. |
| The chart may be shifting from continuation to reversal. | Key reversal | Key reversal helps classify possible control shifts, but only after surrounding context is checked. |
| The same area has different meanings across timeframes. | Multi-timeframe analysis | Timeframe context helps prevent a small reaction from being overstated as a major structural level. |
A cleaner reading order is classification first, then comparison, then strategy logic. Naming the chart behavior correctly makes it easier to separate nearby concepts before a broader decision framework is added.
FAQ
What are price action core concepts?
Price action core concepts are the basic chart-reading ideas used to classify levels, reactions, pressure, imbalance, and possible reversal behavior. The main concepts include support, resistance, supply and demand, and key reversal behavior.
Are price action core concepts the same as a trading strategy?
No. They help organize chart behavior, but a trading strategy needs additional rules for context, confirmation, invalidation, risk boundaries, and review criteria.
How are support and resistance different from supply and demand?
Support and resistance describe reaction areas where price previously responded. Supply and demand describe pressure and imbalance behind the movement. The ideas can overlap on a chart, but they do not mean the same thing.
Is key reversal a prediction signal?
No. Key reversal is a reversal-reading concept that depends on context and later behavior. It becomes weaker when it is treated as a standalone prediction label.
Which price action concept should come first?
Start with the chart-reading problem. Use support or resistance for reaction areas, supply and demand for pressure or imbalance, and key reversal for possible control shifts after context is visible.