Liquidity in trading has two different meanings that should be separated before reading the chart. Market liquidity describes how easily transactions can be executed with limited cost and price impact. In price-action analysis, liquidity is also used as a chart-based label for visible areas where traders may expect order interest to concentrate.
Definition: Market liquidity is an execution condition related to spread, depth, transaction speed, and price impact. Price-action liquidity is an analytical interpretation built from visible highs, lows, range edges, and later price behavior around those areas. The chart can show the price sequence, but it does not directly reveal every resting order, stop order, or participant motive.
Key Points
- Market liquidity and chart-based liquidity describe different things and should not be treated as interchangeable.
- Buy-side and sell-side liquidity describe the location of a watched price area, not a confirmed inventory of hidden orders.
- Sweeps and grabs describe price behavior through a visible area, while swing failures and traps require failure after the level is challenged.
- A probe through a high or low does not establish rejection by itself. Price can return through the level, remain beyond it, or continue away from it.
- Liquidity voids describe a different type of structure from stop-cluster concepts because the focus is rapid price movement rather than the location of a watched high or low.
Market Liquidity vs Price-Action Liquidity
Market liquidity concerns execution. A more liquid market can normally absorb transactions with less friction and smaller price impact, while weaker liquidity can produce wider spreads, poorer fills, or larger price movement for the same trade size.
Price-action liquidity uses the term differently. Traders mark visible highs, lows, repeated levels, and range boundaries because those areas may attract orders and attention. The chart shows that the reference area exists. It does not show the complete distribution of hidden orders behind that level.
| Meaning | What can be evaluated | Main boundary |
|---|---|---|
| Market liquidity | Spread, depth, execution quality, transaction speed, and price impact | Describes the ability of the market to absorb transactions |
| Price-action liquidity | Visible highs, lows, repeated levels, probes, acceptance, rejection, and failure | Describes a chart-based structural interpretation rather than direct observation of every order |
Price-Action Liquidity Classification
Once the chart-based meaning is established, classification becomes easier if location and behavior are kept separate. Some concepts identify where the watched area sits. Others describe what price does when that area is tested.
| Liquidity concept | What it classifies | Structural boundary |
|---|---|---|
| Buy-side liquidity | A watched area above the current price | Location above price comes first; later behavior determines whether the area is rejected or accepted through. |
| Sell-side liquidity | A watched area below the current price | Location below price comes first; later behavior determines whether the move below it holds or fails. |
| Equal highs | A repeated upper price reference | The repeated highs make the area visible, but do not determine the outcome of a later test. |
| Equal lows | A repeated lower price reference | The repeated lows identify a visible area without proving that price must reverse there. |
| Liquidity sweep | A move through a watched area followed by behavior that must still be evaluated | The probe alone is incomplete; return, rejection, acceptance, and continuation separate different outcomes. |
| Liquidity grab | A sharper probe through a visible reference area | The label describes the price event, while later behavior determines whether the move failed or developed into acceptance. |
| Liquidity void | A rapid price-movement area with limited visible two-way interaction | The focus is movement through price rather than a watched stop area above or below a specific level. |
| Stop hunting | An interpretation that a move through an obvious level affected clustered stops | The chart can show the level and the price move, but participant intent and the exact stop inventory are not directly observable from price alone. |
| Swing failure | Failure to maintain price beyond a prior swing point | The move must extend beyond the reference swing and then fail to hold beyond it. |
| Bull trap | Failed upside acceptance after a visible break | The trap classification requires the attempted upside break to lose acceptance. |
| Bear trap | Failed downside acceptance after a visible break | The trap classification requires the attempted downside break to lose acceptance. |
Location, Probe, and Later Price Behavior
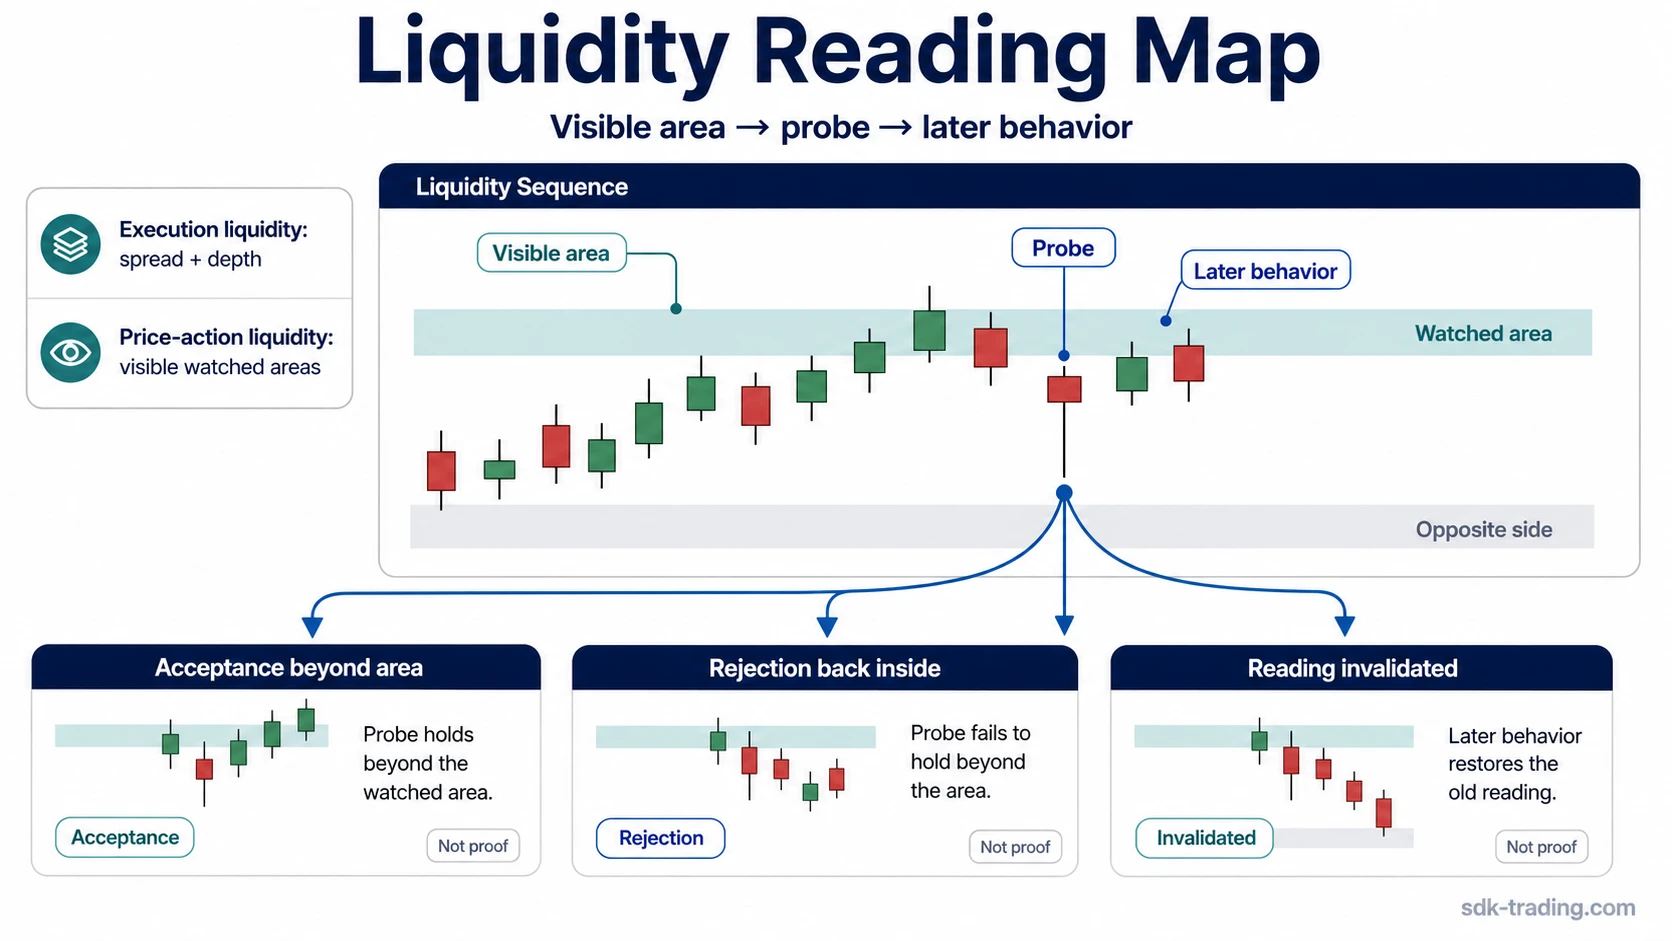
A useful price-action liquidity sequence can be separated into three stages.
| Stage | Observable question | What it establishes |
|---|---|---|
| 1. Reference area | Is there a visible prior high, low, repeated level, or range boundary? | The location being tested |
| 2. Probe | Does price trade through or beyond that reference? | The test of the area |
| 3. Later behavior | Does price return through the level, remain beyond it, or continue farther away? | Whether the initial probe developed into rejection, acceptance, continuation, or failure |
Sequence check: A wick through a visible level establishes that the level was tested. It does not by itself establish why the move occurred or how the completed sequence should be classified.
What the Chart Can and Cannot Show
The chart can show objective price information: where a prior high or low formed, whether price traded beyond it, where a candle closed, whether price returned through the level, and whether later candles accepted above or below the area.
The chart does not reveal the complete hidden order book. It cannot identify every stop resting around a level or establish the motive of the participants who caused the move. Terms such as liquidity grab or stop hunting therefore add an interpretation to observable price behavior.
This distinction makes the reading more precise. The level, probe, close, and follow-through can be tested directly from price. Claims about exactly who was stopped out or whether the move was deliberately designed to trigger those stops require information that the chart alone does not provide.
Liquidity Sweeps, Grabs, Swing Failures, and Traps
These concepts overlap because each can involve movement through a visible price reference, but they classify different parts of the sequence.
Sweep and grab language focuses on the probe through the area. Swing failure focuses on the inability to remain beyond a prior swing. Bull-trap and bear-trap language focuses on failed acceptance after traders respond to an apparent break.
Classification boundary: Use the narrowest observable description first. Identify the level and the price behavior before adding an explanation about liquidity or participant behavior.
When a Liquidity Reading Loses Support
A price-action liquidity interpretation becomes weaker when the reference area is poorly defined, the probe cannot be separated from normal price noise, or later behavior contradicts the initial reading.
Acceptance beyond the watched area is especially important. If price moves above an earlier high and continues building structure above it, a failed-upside interpretation loses support. The same logic applies when price moves below a lower reference and remains accepted below it.
Fast movement also needs careful classification. A large candle or rapid move is not sufficient by itself to establish a liquidity void, just as one wick through a level is not sufficient to establish a completed sweep or trap sequence.
Liquidity FAQ
What does liquidity mean in trading?
Liquidity can refer to market execution conditions, including spread, depth, and price impact. In price-action analysis, the same word is also used for visible chart areas where traders may expect orders or attention to concentrate.
Is a liquidity sweep the same as a liquidity grab?
The terms overlap, but they are not always used identically. Both can describe movement through a watched area, while the size of the probe and the behavior that follows affect the more specific classification.
What is the difference between buy-side and sell-side liquidity?
In chart-based liquidity terminology, buy-side liquidity describes watched areas above price and sell-side liquidity describes watched areas below price. These labels identify location before the outcome of a later test is known.
Does a liquidity sweep always mean price will reverse?
No. Price can return through the tested area, remain beyond it, or continue farther away. The probe itself does not determine the later outcome.