A bull trap is a trading structure where price breaks above a visible high, resistance area, or range ceiling, then fails to sustain acceptance above that level.
The break is only the first event. The classification becomes more defensible when price returns below the breached area or back inside the prior range, showing that the upside break did not hold as accepted market structure.
If price holds above the broken level and builds stable structure there, the bull trap label weakens or fails. The distinction is not the break itself, but what price does after the break.
Definition: A bull trap is a failed upside breakout in which a move above a watched level attracts bullish interpretation, but later price action rejects or loses acceptance above that level.
Key Points
- A bull trap starts with a visible upside reference, such as a prior high, resistance area, or range ceiling.
- A wick or brief break above the level is not enough by itself; the market must show whether the higher area is accepted or rejected.
- A return below the breached area makes the failed-breakout interpretation stronger.
- Accepted structure above the level invalidates or weakens the trap label.
What Is a Bull Trap in Trading?
In trading, a bull trap describes an upside break that initially looks like a bullish breakout but later fails to hold above the level that was broken. The level usually matters because it was visible before the break: a prior swing high, range ceiling, resistance area, or clustered high that many market participants could identify.
The trap logic comes from failed acceptance. Price trades above the watched area, but buyers do not maintain control there. When price returns below the breached level, the breakout attempt is reclassified as a failed move rather than a clean bullish continuation.
A bull trap is therefore a structure reading, not proof of intent, manipulation, or a guaranteed reversal. The useful question is whether the market accepted the higher area or rejected it after testing it.
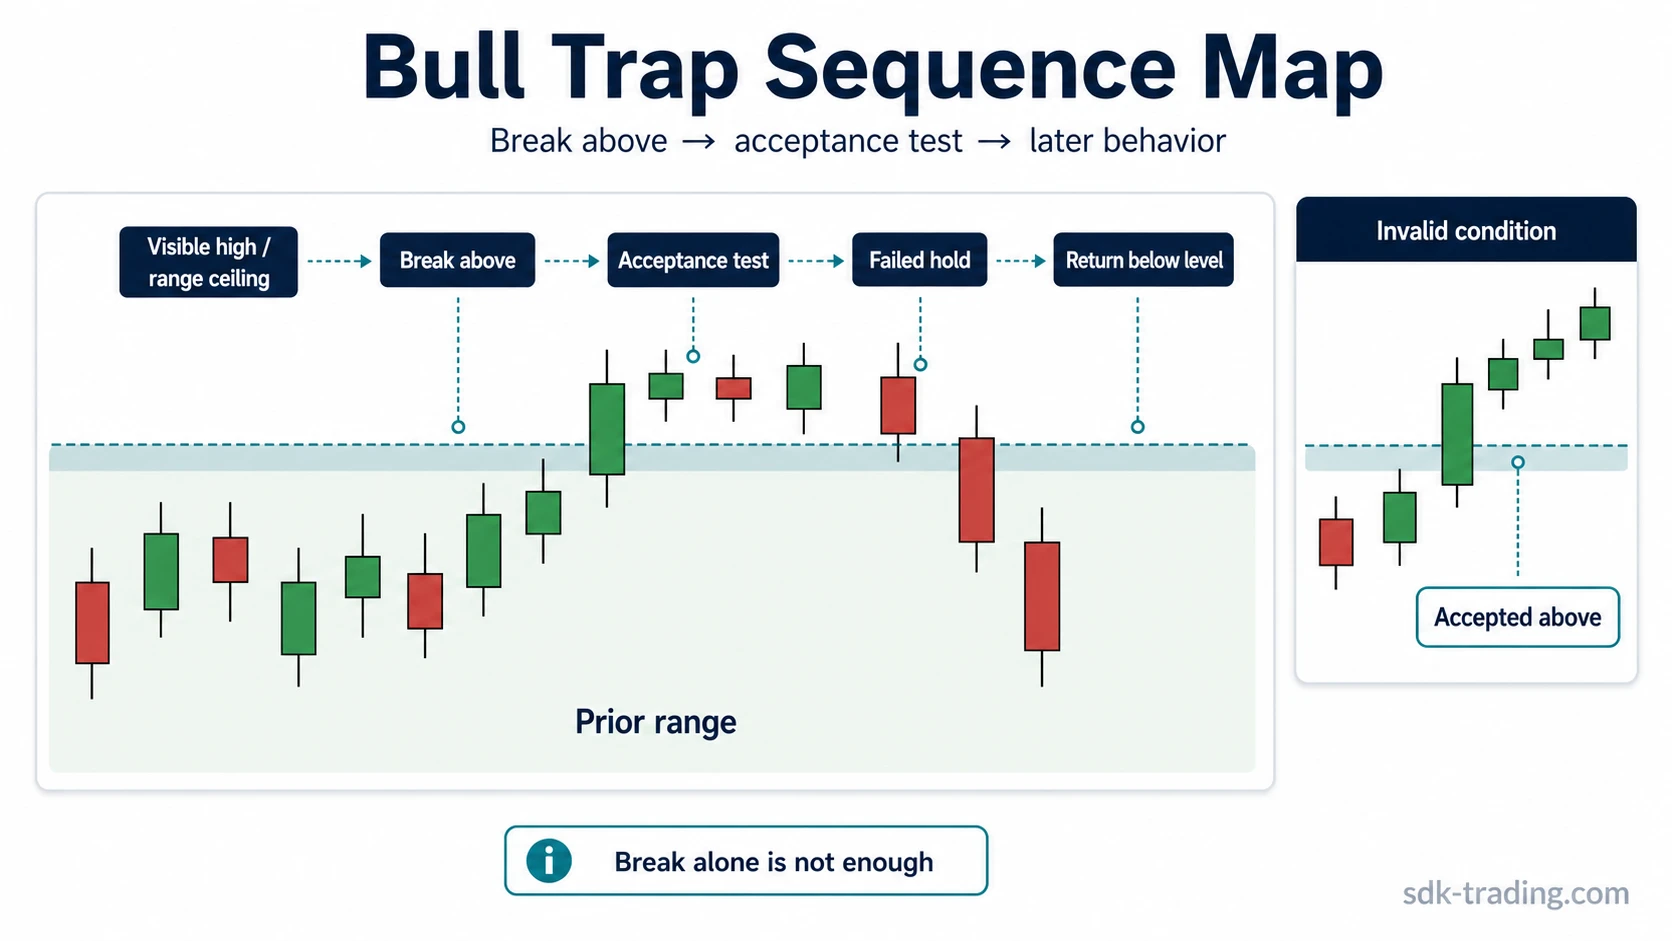
Bull Trap Classification Test
A bull trap reading is stronger when the structure passes a sequence test. Each step narrows the difference between a normal breakout, a temporary probe, and a failed upside break.
| Step | What to observe | Why it matters |
|---|---|---|
| Visible upside reference | Price approaches a prior high, resistance area, or range ceiling that was already clear before the break. | The level needs to be meaningful before the move, not created after the fact. |
| Break above the level | Price trades above the watched area through a wick, candle close, or short sequence. | The break starts the question, but it does not complete the classification. |
| Acceptance test | Price attempts to hold above the breached area or form a base above it. | A stronger breakout normally needs evidence that the higher area is being accepted. |
| Failed acceptance | Price cannot hold above the level, stalls, rejects, or quickly loses the higher area. | This is the diagnostic boundary between a simple break and a failed breakout reading. |
| Recovered range | Price returns below the broken level or back inside the prior range. | Reintegration shows that the breakout attempt has lost structural control. |
| Invalid condition | Price accepts above the level and continues building stable structure there. | The trap label weakens because the market is treating the broken area as accepted rather than rejected. |
How a Bull Trap Forms
A bull trap often begins with a market pushing into a level that was already visible. The area may be a prior high, a range ceiling, or a resistance zone where previous advances stalled.
When price breaks above that level, the move can attract late bullish interpretation. Some participants may read the break as continuation, while others wait to see whether the market can actually hold above the level.
The interpretation changes if the market cannot build there. A weak close, stalled follow-through, repeated rejection, or fast return below the level can show that the break did not create accepted higher structure. The trapped-buyer idea appears because bullish positioning or bullish interpretation was encouraged above the level, then pressured when price returned below it.
Volume, candle body quality, momentum, or indicator behavior can support the assessment, but they do not define the structure alone. A high-volume break that immediately fails still needs the same acceptance and reintegration test.
Clean, Weak, and Invalid Bull Trap Readings
Not every break above a high deserves the same label. The quality of the classification depends on how visible the original level was, how price behaved above it, and whether the market later accepted or rejected the higher area.
| Reading quality | Typical structure | Diagnostic meaning |
|---|---|---|
| Clean bull trap | A clear prior high or range ceiling is broken, price fails to hold above it, and the market returns below the breached area. | The failed acceptance is visible, and the prior structure has been recovered after the upside probe. |
| Weak bull trap | Price briefly trades above a level, but the level was not very clear, the return below is choppy, or the acceptance test remains unresolved. | The move may describe a failed probe, but the evidence is not clean enough to treat the classification as strong. |
| Invalid bull trap | Price breaks above the level, holds above it, and begins building accepted structure in the higher area. | The market is no longer rejecting the break; the failed-breakout label should be reduced or removed. |
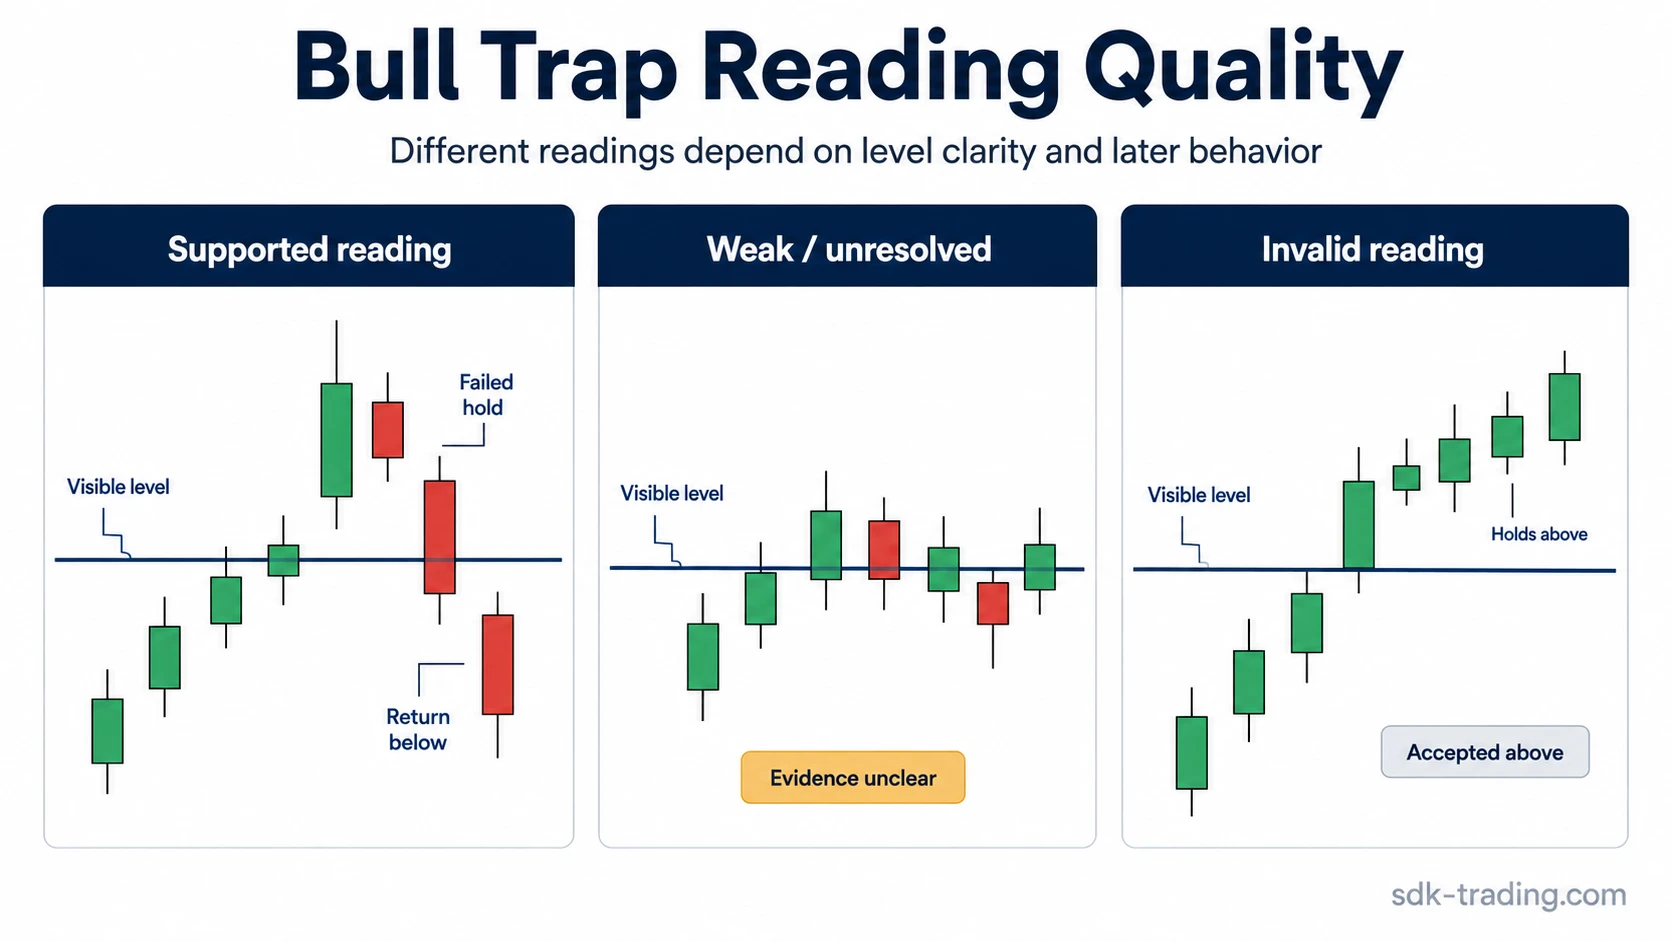
Reading note: The same initial break can move through these categories as new candles develop. A clean trap reading needs more than the first move above the level.
Bull Trap vs Bear Trap and Other Liquidity Events
A bull trap is easiest to classify when it is separated from nearby price-action concepts. The overlap usually comes from the same visible behavior: price moves beyond a watched area, then later behavior changes the interpretation.
| Concept | Main difference | Boundary to watch |
|---|---|---|
| Bull trap | Price breaks above a visible upside level, then fails to sustain acceptance above it. | Acceptance above the broken high versus return below it. |
| Bear trap | A bear trap forms on the opposite side, when price breaks below a watched downside level and later fails to hold below it. | Acceptance below the broken low versus recovery back above it. |
| Liquidity sweep | A sweep focuses on price probing a known liquidity area; a bull trap needs failed upside acceptance after the probe. | Probe alone versus failed acceptance and reintegration. |
| Liquidity grab | A grab describes a fast move through visible liquidity; a bull trap is more specific because it centers on a failed upside breakout. | Speed of the probe versus completed failed-breakout structure. |
| Legitimate breakout | A breakout becomes more defensible when price accepts above the level and uses the broken area as structure. | Holding above the level versus falling back below it. |
| Equal highs | Equal highs mark a visible upside reference; they do not become a bull trap unless price breaks above them and later fails acceptance. | Resting highs versus post-break behavior. |
Common Bull Trap Misreadings
Any wick above a high is not automatically a bull trap. A wick can show a probe, but the classification depends on what happens after price tests the higher area.
A red candle after a breakout is not enough by itself. The more useful evidence is whether the market loses the breached level and returns below it after failing to hold the higher area.
Volume or divergence does not define the trap. Strong volume, weak momentum, or RSI/MACD divergence can add context, but the structure still depends on the break, acceptance test, and reintegration.
A bull trap is not proof of manipulation. The label describes observable price behavior. It does not prove why the move happened or who caused it.
A bull trap does not guarantee a bearish reversal. Price may reverse, range, retest, or rebuild. The label only describes the failed upside breakout structure.
Practical Bull Trap Scenario: Failed Break Above a Range Ceiling
Price repeatedly tests a range ceiling that has already capped several advances. The highs are visible, and each push into the area attracts attention because the market has not accepted above it yet.
A later candle trades above the ceiling and briefly extends beyond the prior highs. The move looks like a breakout at first, but the next attempts to hold above the level stall. Buyers cannot build a stable base in the higher area.
The classification changes when price returns below the ceiling and starts trading back inside the old range. That reintegration makes the failed-breakout interpretation stronger because the market tested the higher area and could not maintain acceptance there.
The same scenario would remain unresolved if price chopped around the broken level without a clear return below. It would weaken or fail as a bull trap if price accepted above the ceiling and began using the area as support for continued structure.
What Weakens a Bull Trap Reading?
A bull trap reading weakens when the original level was not visible before the break, when the move above the level was too minor to create a meaningful acceptance test, or when price remains above the broken area long enough to build structure.
It also weakens when the only evidence is an indicator signal. Momentum divergence, volume expansion, or a large candle can be useful context, but a structural label needs structural evidence.
The cleanest invalidation is acceptance above the breached level. Once the market builds above the level, the failed-breakout interpretation no longer describes the main behavior.
FAQ
What does bull trap mean in trading?
A bull trap means price breaks above a visible high, resistance area, or range ceiling, but later fails to sustain acceptance above that level.
Is every failed breakout a bull trap?
No. A failed breakout becomes a stronger bull trap reading when the upside level was visible beforehand, price tested above it, and later returned below the breached area.
How is a bull trap different from a bear trap?
A bull trap forms after a failed break above an upside level. A bear trap forms after a failed break below a downside level.
Can indicators confirm a bull trap?
Indicators can support the reading, but they do not define it. The structure depends on the break above the level, failed acceptance, and return below the breached area.
When is a bull trap reading invalid?
A bull trap reading is invalid or weakened when price accepts above the broken level and builds stable structure in the higher area.