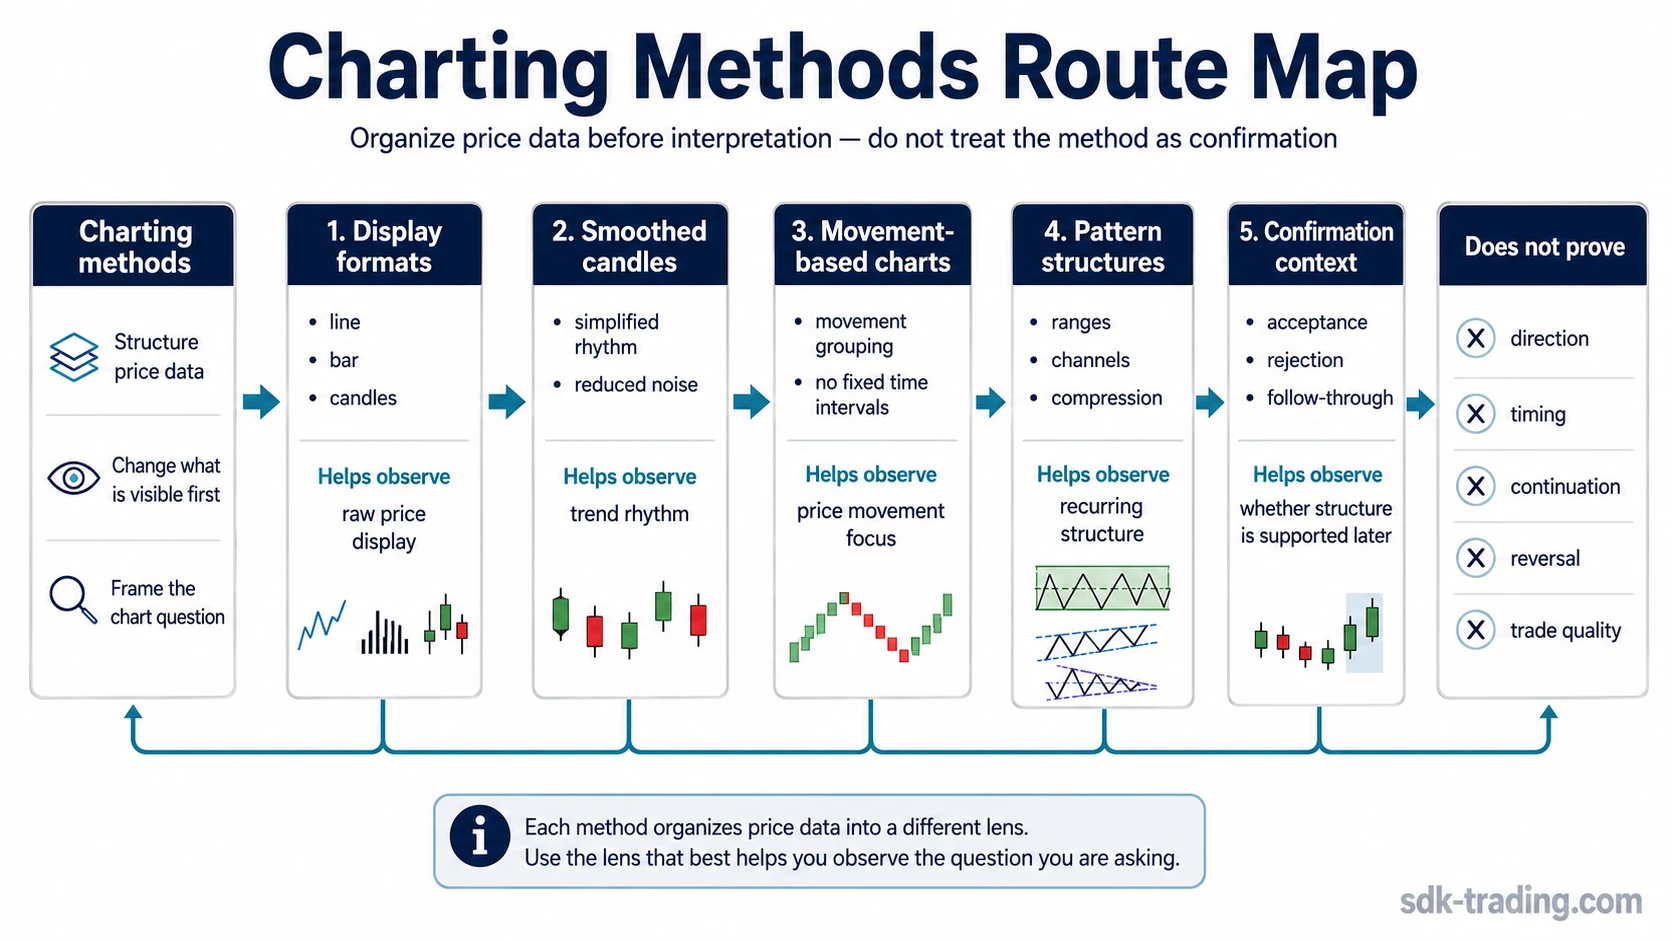
In trading, charting methods are ways to structure price data before interpretation. A method can change what appears most visible first: raw price bars, candle structure, smoothed candles, movement-based charts, or recurring chart patterns. The method changes the viewing lens, not the market evidence.
Charting methods organize market data so price behavior can be examined from a specific angle. They help frame the question a trader is asking, but they do not prove direction, timing, continuation, reversal, or trade quality by themselves.
- Charting methods affect how price information is displayed, filtered, or grouped.
- Chart types, chart patterns, and confirmation tools are related, but they are not the same thing.
- A cleaner chart view can make interpretation easier, but it can also hide detail or make weak structure look stronger than it is.
- The useful question is not “which method is best,” but which method fits the chart question being asked.
What charting methods mean in trading
A charting method decides how price movement is organized before analysis begins. A candlestick chart emphasizes open, high, low, and close behavior. A smoothed candle method reduces some visual noise. A non-time-based chart groups movement without using fixed time intervals. A chart-pattern approach looks for repeated structures such as channels, triangles, or ranges.
The method changes the lens, not the outcome. A trader may see the same market differently on a standard candlestick chart, a Heikin Ashi chart, or a movement-based chart because each method emphasizes and compresses different information.
Simple example: A standard candlestick chart may show every open-high-low-close detail, while a smoothed candle view may make the same trend look cleaner. That cleaner view can help identify rhythm, but it can also hide sharp rejection, gaps, or intrabar pressure that still matter.
How charting methods differ from chart types and chart patterns
Charting methods, chart types, and chart patterns often appear together, which is why they are easy to confuse. The distinction is practical: one changes how price is displayed, one names the display format, and one interprets a recurring structure inside the chart.
| Concept | What it describes | Example | Boundary |
|---|---|---|---|
| Charting method | The way price data is structured, filtered, or grouped before interpretation. | Standard candles, Heikin Ashi, non-time-based grouping, pattern analysis. | The method frames price behavior; it does not confirm the trade idea. |
| Chart type | The visual format used to display market data. | Line chart, bar chart, candlestick chart, area chart. | The format changes visibility, not reliability by itself. |
| Chart pattern | A recurring structure identified inside price movement. | Channel, triangle, range, flag, double top, double bottom. | The pattern is only a structural reading until context and later behavior support it. |
| Confirmation tool | An additional check used to judge whether the structure has follow-through. | Acceptance, volume context, retest behavior, invalidation level. | Confirmation is separate from the charting method that made the structure visible. |
Main families of trading charting methods
The main charting-method families can be separated by what they change in the chart. Some methods change the display format. Some smooth or transform price. Some group movement without fixed time intervals. Others focus on recurring structures inside the chart.
| Method family | What it changes | Helps with | More detail | Boundary |
|---|---|---|---|---|
| Standard price-display methods | How raw price data is shown visually. | Comparing open, high, low, close, and overall price path. | types of trading charts | A clearer display does not make the interpretation correct. |
| Smoothed or transformed candle methods | How candles are calculated or visually simplified. | Seeing trend rhythm, continuation pressure, and reduced short-term noise. | Heikin Ashi | Smoothing can hide detail that still matters for risk and invalidation. |
| Movement-based charting methods | How price movement is grouped without fixed time intervals. | Filtering time noise and focusing on meaningful price movement. | non-time-based charts | Filtering time does not remove false breaks or weak follow-through. |
| Pattern-based charting methods | How recurring price structures are classified. | Recognizing ranges, channels, compression, expansion, and breakout structures. | Use only after the structure is visible and context supports the reading. | A named pattern is not a signal without acceptance, rejection, or follow-through behavior. |
| Context and confirmation methods | How the chart reading is checked against surrounding evidence. | Separating possible structure from usable interpretation. | Apply after the charting lens has clarified the structure. | Confirmation belongs after observation, not inside the method name itself. |
When a charting method helps and where it can mislead
A charting method is useful when it makes a specific market question easier to see. If the question is about raw candle behavior, a standard candlestick view may be more useful. If the question is about trend rhythm, a smoothed method may reduce some noise. If the question is about movement rather than time, a non-time-based chart may help separate active movement from inactive periods.
| Question | Useful charting lens | Risk if overused |
|---|---|---|
| What did price actually do inside each period? | Standard bars or candlesticks. | Raw detail can feel noisy without structure or context. |
| Is trend rhythm easier to see after smoothing? | Smoothed candle methods. | Smoothing may hide rejection, hesitation, or fast changes in pressure. |
| Is movement more important than fixed time intervals? | Movement-based or non-time-based charts. | Time compression can make slow acceptance or distribution harder to notice. |
| Is price forming a recognizable structure? | Pattern-based analysis. | A clean-looking pattern can fail if acceptance and follow-through do not appear. |
Boundary: Charting methods organize price information. They do not remove false signals, guarantee cleaner decisions, or replace confirmation. A method can make a structure easier to see while still leaving the trader responsible for context, invalidation, and follow-through.
Choosing the next charting topic
Start with the chart question instead of the chart label. If the goal is to understand display formats, compare chart types first. If the goal is to reduce visual noise, study how smoothed candles transform the view. If the goal is to remove fixed time intervals, examine movement-based charts. If the goal is to interpret recurring structures, treat patterns as observations that still need context.
| If the chart question is… | Start with… | Do not assume… |
|---|---|---|
| How do different display formats change what I see? | types of trading charts | That one format is automatically more reliable than another. |
| How does candle smoothing change trend interpretation? | Heikin Ashi | That a smoother trend view confirms continuation. |
| How can price be grouped without fixed time intervals? | non-time-based charts | That removing time removes context risk. |
Practical filter: A charting method is strongest when it matches the question being asked. It becomes weaker when it is used as a shortcut for confirmation, direction, or trade validity.
FAQ
Are charting methods the same as chart patterns?
No. A charting method is the way price data is structured or viewed. A chart pattern is a recurring structure identified inside that view. A pattern still needs context and follow-through before it carries practical meaning.
Are charting methods the same as chart types?
Not exactly. Chart types are display formats such as line, bar, or candlestick charts. Charting methods include those formats, but can also include smoothing methods, movement-based charts, and pattern-based interpretation.
Does a charting method confirm a trade?
No. A charting method can make structure easier to observe, but confirmation depends on later behavior, context, acceptance, rejection, invalidation, and risk definition.
Which charting method should a beginner learn first?
A beginner usually benefits from understanding standard price displays first, especially how candles or bars show open, high, low, and close behavior. Smoothing methods, non-time-based charts, and pattern structures become more useful after the basic display logic is clear.