Trend indicators in trading are technical tools used to frame directional movement, trend persistence, smoothing behavior, and changes in trend strength. The useful first filter is not the broad word “trend,” but which trend lens the reader needs: moving-average smoothing, moving-average separation, directional strength, timing since highs or lows, cloud structure, or trailing trend overlays.
Definition: Trend indicators are chart indicators that help classify direction, persistence, smoothing behavior, and directional strength. They do not all measure the same input: some smooth price, some compare moving averages, some measure directional movement, and others build a broader trend-following structure around price position.
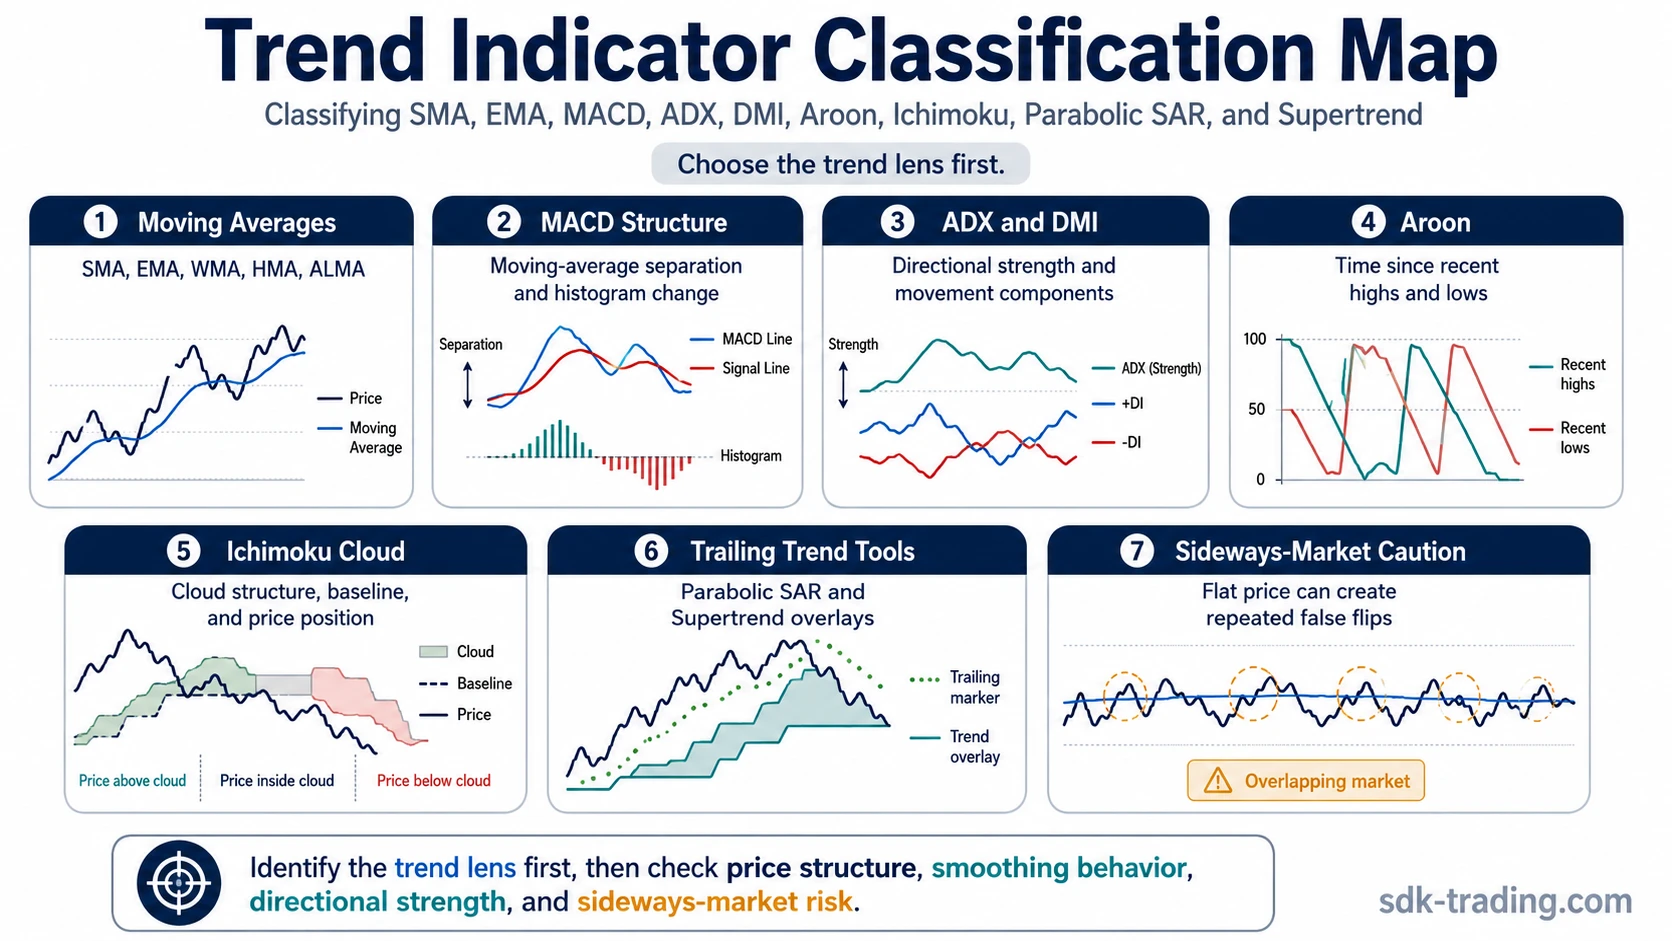
A trend indicator is not the same thing as a trend signal. SMA, EMA, MACD, ADX, DMI, Aroon, Ichimoku Cloud, Parabolic SAR, and Supertrend can all support trend analysis, but they organize trend information through different calculations and should not be read as interchangeable evidence.
Key Points
- Trend indicators in trading classify direction, persistence, smoothing behavior, moving-average separation, and directional strength.
- Moving averages, MACD, ADX, DMI, Aroon, Ichimoku Cloud, Parabolic SAR, and Supertrend do not measure trend in the same way.
- A trend reading can weaken when price flattens, overlaps the indicator, or produces repeated countertrend flips.
- The useful question is which trend tool fits the reader’s problem: smoothing, strength, timing, crossover behavior, cloud structure, or trailing overlay.
Trading Trend Indicator Learning Path
The cleanest way to read trend indicators is to move from simple smoothing to more complex trend structure. A moving average explains price smoothing first. Directional tools then help separate trend direction from trend strength. Multi-line and trailing tools add structure, but they also require more care because they can create noisy readings when the market moves sideways.
| Reader question | Best route | Trend-reading boundary |
|---|---|---|
| What is the simplest trend-smoothing baseline? | SMA indicator | Uses equal weighting across the selected lookback period. |
| What if newer prices should affect the average more? | EMA indicator | Responds faster than a simple average because recent prices receive more weight. |
| What if the average should use linear weighting? | WMA indicator | Gives newer prices larger linear weights, which can make the line more reactive. |
| What if the goal is a smoother moving average with reduced delay? | HMA indicator | Uses weighted-average logic to reduce lag while keeping a smoother curve. |
| What if the average should be smoother and less noisy? | ALMA indicator | Uses a Gaussian-style weighting approach to balance smoothness and responsiveness. |
| What if trend momentum is being read through moving-average separation? | MACD indicator | Compares moving-average relationships and signal-line behavior. |
| What if the focus is the MACD histogram rather than the full MACD structure? | MACD Histogram | Tracks the distance between MACD and its signal line as momentum expands or contracts. |
| What if the question is trend strength rather than trend direction? | ADX indicator | Measures directional strength without acting as a full direction signal by itself. |
| What if directional movement needs to be separated into positive and negative components? | Directional Movement Index | Separates positive and negative directional movement before strength is interpreted. |
| What if the reader needs to know how recently highs or lows are being made? | Aroon indicator | Uses time since recent highs and lows to frame trend timing and direction. |
| What if the trend reading needs cloud structure, baseline, and momentum context? | Ichimoku Cloud | Combines multiple lines and cloud structure rather than relying on one moving average. |
| What if the reader needs a trailing trend marker? | Parabolic SAR | Uses trailing dots that can flip quickly when price changes direction. |
| What if the reader wants a volatility-adjusted trend overlay? | Supertrend indicator | Uses volatility-adjusted bands to frame directional bias and trend changes. |
Trend Sequence Before Signal
A trend indicator becomes more useful when the reader separates sequence from isolated indicator events. A moving-average crossover, a MACD turn, an ADX rise, or a Supertrend flip can mean different things depending on whether price is already trending, compressing sideways, or reacting after an extended move.
The sequence usually matters more than one indicator event. A clean trend reading often begins with directional price behavior, then smoothing or strength tools help organize that behavior. A weaker reading appears when price repeatedly crosses the tool, the indicator flattens, or the signal appears far after the main movement has already developed.
Trend context filter: Check whether the tool is measuring smoothing, direction, strength, momentum separation, timing, cloud structure, or trailing behavior. A reading weakens when the tool’s calculation does not match the market condition being read.
Moving Average and Directional Tool Groups
Trend indicators can be grouped by what they measure. Moving averages reduce price noise and frame direction through smoothing. MACD turns moving-average separation into a momentum structure. ADX and DMI separate strength and directional movement. Aroon reads timing since highs and lows. Ichimoku, Parabolic SAR, and Supertrend add broader trend-structure behavior.
| Tool group | Typical reading | Common misread |
|---|---|---|
| Moving averages | Smoothed direction and distance between price and the average. | Treating every crossover as a clean trend change during sideways movement. |
| MACD-style tools | Moving-average separation, signal-line behavior, and histogram expansion or contraction. | Reading late momentum change as if it always marks a fresh trend start. |
| Directional-strength tools | Strength, directional movement, and trend persistence. | Confusing trend strength with immediate direction when the tool does not provide both equally. |
| Timing-based tools | How recently highs or lows have appeared inside the lookback period. | Reading timing since highs or lows as if it were the same as moving-average smoothing. |
| Cloud and trailing tools | Trend structure, price position, trailing behavior, and regime changes. | Using a complex trend overlay as if it were a single isolated signal. |
Countertrend Ambiguity and Sideways Markets
Trend indicators often look weakest when the market is moving sideways. Price may cross a moving average several times, MACD may rotate around its signal line, and trailing overlays may flip direction without creating a durable trend reading.
Countertrend movement also creates ambiguity. A pullback inside a trend can look like a reversal on a fast tool, while a slower tool may still show trend persistence. This does not make one tool automatically better. It means the reader has to match the tool’s speed, lookback, and smoothing behavior to the market condition.
Limitation: Trend indicators are most fragile when price is flat, overlapping, or reacting in both directions around the same level. In that environment, faster tools can overreact and slower tools can respond too late.
Related Trend Indicator Comparisons and Frameworks
Trend analysis often requires separating definition, comparison, and application. Some questions are about how one indicator is built, while others are about how two tools differ or how trend direction, trend strength, and signal timing fit into a broader reading process.
| Reader problem | Best route | Use when |
|---|---|---|
| The reader needs to separate moving average types. | Moving average types explained | The question is about SMA, EMA, WMA, HMA, ALMA, and their smoothing behavior. |
| EMA and WMA seem similar but react differently. | EMA vs WMA | The issue is exponential weighting versus linear weighting. |
| The reader needs the broader trend-indicator category. | Trend indicators explained | The question is wider than one specific trend tool. |
| The reader wants a framework built around ADX behavior. | ADX strategy framework | The issue has moved from ADX definition into conditional interpretation. |
| The reader wants a framework built around Ichimoku structure. | Ichimoku strategy framework | The question involves multiple Ichimoku components rather than one line. |
| The reader is comparing Ichimoku with moving-average logic. | Ichimoku vs moving average | The issue is multi-line cloud structure versus simpler smoothing tools. |
| The reader is selecting trend tools for swing trading. | Best indicators for swing trading | The question is broader and includes tool selection for a trading style. |
How to Read Trend Indicators
Start with the market condition. A trend indicator reading has different meaning in a clean directional move, a controlled pullback, a range, or an extended move that has already traveled far from its average.
Then check the tool’s mechanism. A moving average smooths price, MACD reads average separation, ADX measures strength, DMI separates directional movement, Aroon reads timing since highs and lows, and cloud or trailing tools add structure. The reading is stronger when the market condition and the tool’s calculation are aligned.
When Trend Indicator Readings Need Caution
Trend indicator readings become weaker when the selected tool is too fast for the market structure, too slow for the reader’s horizon, or too complex for the question being asked. A fast average may react to noise, while a slower trend framework may identify the change only after most of the move has already developed.
The safer approach is to classify the trend lens first. Smoothing, separation, strength, timing, cloud structure, and trailing overlays each answer a different question. That separation keeps trend indicators from becoming a group of disconnected signals with no calculation hierarchy.