The EMA indicator is an exponential moving average that gives more weight to recent prices than older prices. That makes the line smoother than raw price but faster to react than a simple moving average. The faster reaction is useful for reading recent price pressure, but it does not prove trend strength, future direction, or market acceptance by itself.
EMA stands for exponential moving average. In trading, it belongs to the moving-average family of trend indicators. Its main job is to smooth price data while giving newer prices more influence in the calculation. This makes EMA more sensitive than SMA, but the same sensitivity can also make it more vulnerable to noise when price is moving sideways.
Key Points
- The EMA indicator weights recent prices more heavily than older prices.
- The smoothing multiplier controls how quickly the line reacts to new price.
- A shorter EMA reacts faster, while a longer EMA smooths more of the movement.
- EMA still lags because it is calculated from historical price.
- A clean EMA reading depends on slope, price relationship, and surrounding market structure, not on the line alone.
What Is the EMA Indicator?
The EMA indicator is a trend-following moving average that applies exponential weighting to price data. Instead of treating every price in the lookback period equally, it gives more influence to the newest price and gradually less influence to older prices.
That weighting is the main difference between EMA and a basic average. A simple moving average looks back across a fixed window and treats each data point the same. EMA keeps updating from its previous value, so the current line carries both new price information and earlier smoothing history.
This makes EMA useful for describing recent directional behavior. It can show whether price is staying mostly above or below a smoothed reference line, whether the line is rising or falling, and whether recent movement is becoming more directional or more unstable.
The boundary is important. EMA does not measure volume, participation, volatility, market acceptance, or trend strength directly. It only transforms price into a smoother line with greater weight on recent data.
How the EMA Formula Weights Recent Price
The EMA formula is usually explained through two parts: today’s price and the previous EMA value. The current price receives weight through the multiplier, while the previous EMA carries forward the earlier smoothed value.
EMA formula: EMA today = (Price today x multiplier) + (EMA yesterday x (1 – multiplier))
Smoothing multiplier: 2 / (period + 1)
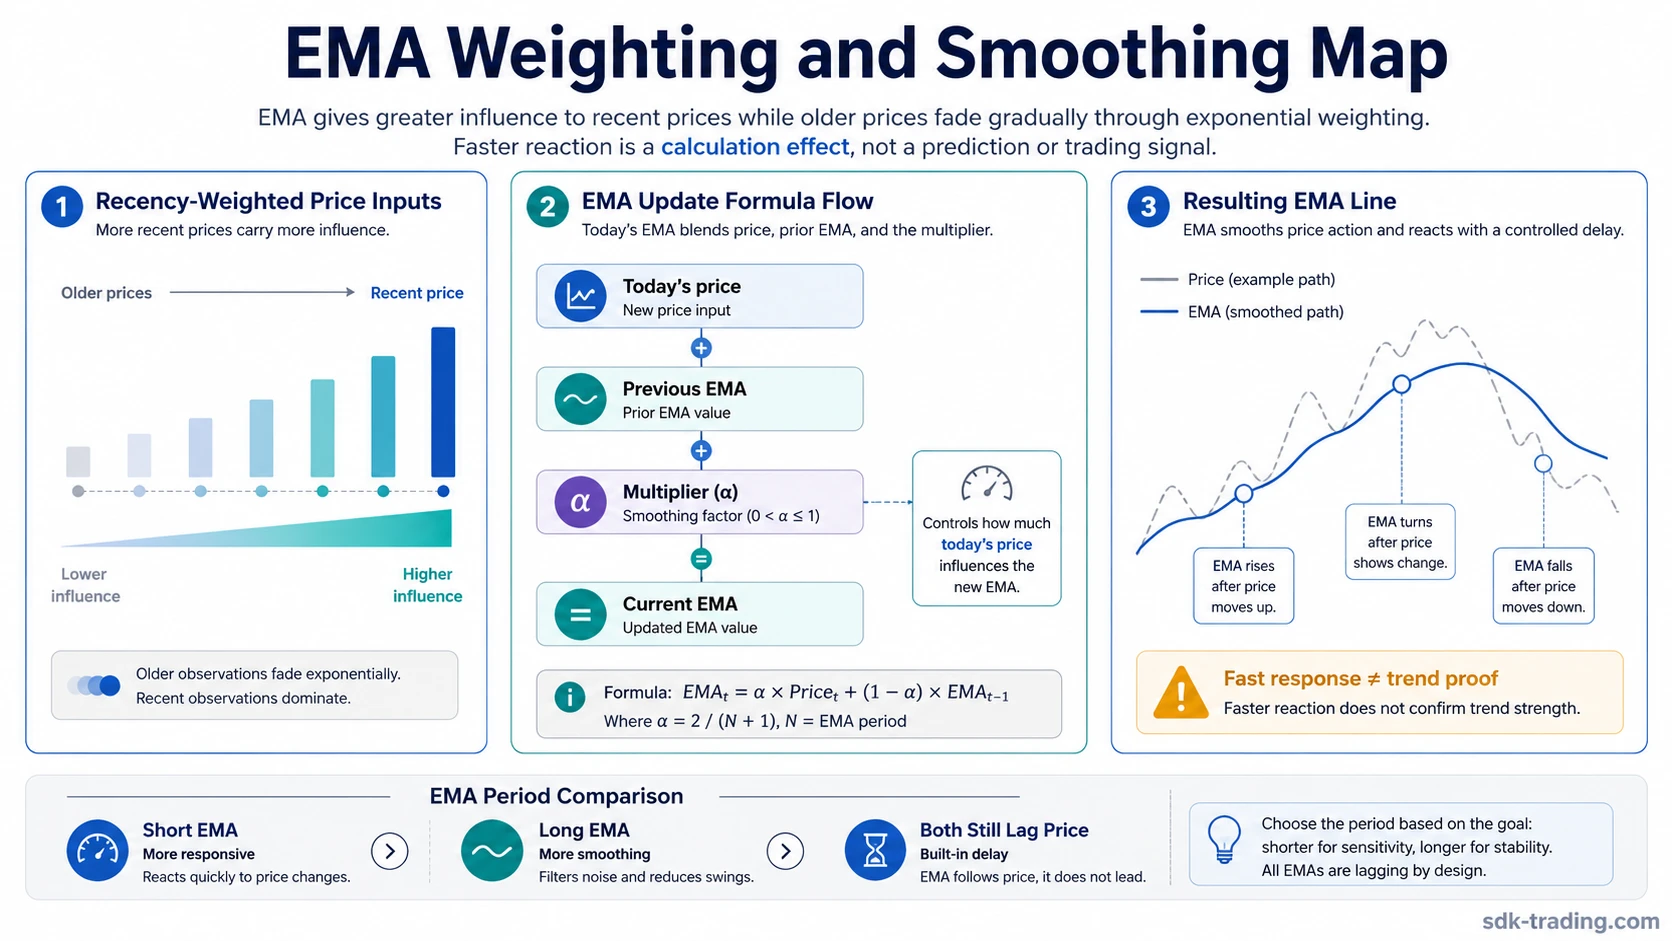
A 10-period EMA has a larger multiplier than a 50-period EMA. That means the 10-period EMA gives more weight to the latest price and reacts more quickly. The 50-period EMA gives less weight to each new price and changes more slowly.
| EMA mechanism | What it does | Why it matters |
|---|---|---|
| Current price | Adds the newest price input. | Gives the EMA recent-price sensitivity. |
| Previous EMA | Carries forward the prior smoothed value. | Makes the line recursive rather than a simple one-time average. |
| Multiplier | Controls how much weight the newest price receives. | A higher multiplier means faster reaction. |
| Period length | Determines the multiplier. | Shorter periods react faster, while longer periods smooth more. |
The recursive structure is why EMA behaves differently from a simple average. Each new EMA value depends partly on the previous EMA value, which already contains older price information. Recent prices have the most influence, but older prices still remain in the line through decay.
This structure also explains why EMA can move quickly without becoming a full trend reading. The line reacts to price because the formula tells it to react. Whether that movement is meaningful still depends on the surrounding market structure.
EMA vs SMA: The Core Difference
EMA and SMA both smooth price, but they do it differently. SMA, or simple moving average, gives equal weight to every price in the selected lookback window. A 20-period SMA treats each of the 20 prices equally. EMA gives more weight to the newest price, so it usually turns faster when recent price changes.
| Feature | EMA | SMA |
|---|---|---|
| Weighting | More weight on recent price. | Equal weight across the lookback window. |
| Reaction speed | Faster. | Slower. |
| Noise sensitivity | Higher when the period is short. | Lower, but more delayed. |
| Main use | Recent-price smoothing. | Broader average price smoothing. |
This is not a recommendation that one is always better. EMA reacts faster, but it can also react faster to unstable movement. SMA reacts slower, but that slower response can sometimes reduce noise. The useful choice depends on what the trader is trying to observe.
The main distinction is sensitivity. EMA gives the newest prices more influence. SMA treats the lookback window more evenly. That difference changes the shape and timing of the line, but neither moving average validates a trend by itself.
How EMA Period Selection Changes the Reading
EMA period selection changes sensitivity. It does not create certainty.
A short EMA, such as a 9-period or 10-period EMA, responds quickly to new price movement. That can make it useful for observing short-term pressure, but it can also turn repeatedly in a choppy market.
A longer EMA, such as a 50-period or 200-period EMA, responds more slowly. It smooths more of the movement and may reduce smaller fluctuations, but it also reacts later when price behavior changes.
| EMA period choice | Typical behavior | Main weakness |
|---|---|---|
| Short period | Fast reaction to recent price. | More noise and repeated line crosses. |
| Medium period | Balanced smoothing and reaction. | Still affected by market regime. |
| Long period | Smoother trend reference. | More lag after sharp changes. |
The period changes the behavior of the line. It does not decide whether the trend is healthy, whether the move is accepted, or whether price will continue.
A shorter setting can make the EMA look more responsive, but that responsiveness comes with a trade-off. The line may follow small fluctuations that never develop into directional structure. A longer setting may reduce that noise, but it can also respond late after a meaningful price change has already started.
The Common Misunderstanding: Fast Response Is Not Accuracy
A faster EMA is not automatically more accurate. It may simply be reacting more quickly to the latest candles.
This becomes a problem when recent price movement is noisy. A short EMA can turn upward after a few strong candles, then flatten or turn down when price immediately fades back. The line moved quickly, but the market did not necessarily accept a directional move.
The useful distinction is this: EMA shows how recent price is being smoothed. It does not tell whether that movement has enough structure, participation, or persistence to matter.
A fast line can describe pressure, but it can also describe noise. The same formula that helps EMA react early can make it unstable when price is rotating without directional follow-through.
This is why the EMA reading should be separated from the broader interpretation. The line can show recent pressure. The chart still has to show whether that pressure is organized, persistent, and aligned with the surrounding structure.
EMA Reading Quality: Clean, Weak, or Invalid
A practical EMA reading should separate the line’s appearance from the quality of the surrounding price behavior. These categories describe interpretation quality, not trade decisions.
| EMA reading quality | What it means | What weakens it |
|---|---|---|
| Clean | Price relationship and EMA slope are consistent with recent trend smoothing. | It still does not prove trend strength by itself. |
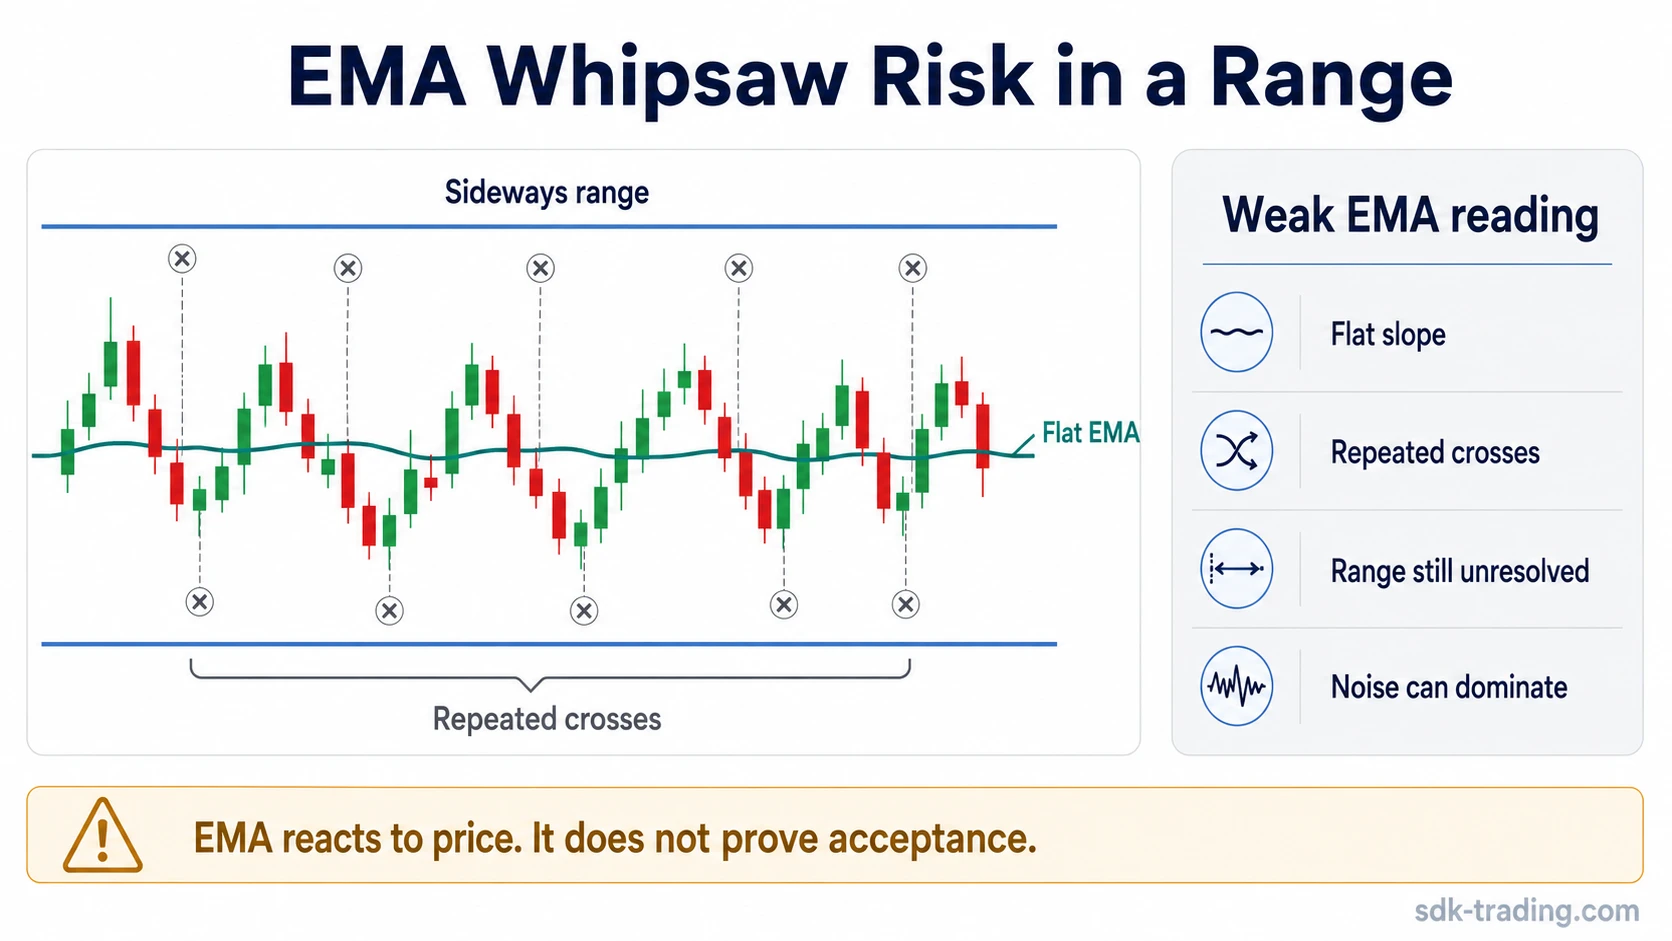
| Weak | Price repeatedly crosses the EMA and the slope flattens. | Whipsaw or range behavior may be dominating the line. |
| Invalid | EMA reading conflicts with structure, volume, or broader trend behavior. | Fast smoothing may be reacting to noise instead of accepted movement. |
A clean reading is usually easier to interpret when price stays mostly on one side of the EMA and the slope is aligned with the recent direction. A weak reading appears when price keeps crossing the line from both sides. An invalid reading appears when the EMA suggests one thing but the broader chart structure suggests another.
EMA should be read as a reference point, not as the final interpretation layer.
This clean, weak, and invalid distinction is useful because it keeps the indicator from becoming mechanical. EMA can describe price behavior, but the quality of the reading depends on whether price structure supports or contradicts what the line appears to show.
EMA Limitations and Whipsaw Risk
EMA has several major limitations. First, it lags. Even a fast EMA is still calculated from historical price. It can react quickly compared with SMA, but it cannot know the next price.
Second, it can produce false-positive readings in flat markets. When price is moving sideways, the EMA may tilt up and down without meaningful directional behavior.
Third, shorter periods increase sensitivity. That can make the EMA look responsive, but the cost is more noise.
Fourth, EMA does not measure the quality of market participation. It does not show whether volume supports the move, whether volatility is expanding, or whether price structure is improving.
A common scenario is a short EMA turning upward after several stronger candles while price remains inside a range. Price then crosses back below the line, returns above it, and crosses again. The issue is not the formula. The issue is that the market is moving sideways, so the EMA is repeatedly recalculating noise.
That is where many weak readings come from. The line changes because price changed, but the surrounding structure has not become directional.
Whipsaw risk is highest when the EMA is short, the market is range-bound, and price keeps moving through the line without building directional separation. In that environment, the indicator may look active while the reading remains weak.
False EMA Readings in Choppy Markets
A false EMA reading often starts with a short burst of price movement. The EMA turns because recent candles carry more weight in the calculation. If price then stalls, reverses, and crosses the line again, the line may describe only short-term movement inside a larger range.
This can happen several times in the same sideways structure. The EMA turns upward, then flattens, then turns downward, while price remains trapped between nearby highs and lows. The formula is working as designed, but the market condition is poor for a clean smoothing interpretation.
The problem is not that EMA is broken. The problem is that a moving average cannot separate accepted trend behavior from unresolved rotation by itself. That separation needs structure, persistence, and a broader reading of price behavior.
How EMA Relates to Other Trend Indicators
EMA is one member of the broader trend-indicator family. Its main role is to smooth price with exponential weighting.
A moving average strategy can use moving averages as part of a broader framework, but the EMA definition itself should stay focused on smoothing, weighting, and reading quality.
Other trend tools solve different problems. HMA is designed as a lag-reduction moving-average variant.
Aroon measures time since a recent high or low rather than calculating a recency-weighted average price.
That distinction keeps EMA in its proper role. EMA is the baseline exponential smoothing model. It can help describe recent price behavior, but stronger interpretation usually comes from comparing the line with structure, participation, volatility, and the broader trend environment.
FAQ
What is EMA in trading?
EMA in trading means exponential moving average. It is a moving average that gives more weight to recent prices, so it reacts faster than a simple moving average while still smoothing raw price movement.
How is the EMA indicator calculated?
EMA is calculated by combining the current price with the previous EMA value. The smoothing multiplier is usually 2 / (period + 1), which controls how much influence the newest price has.
Why does EMA react faster than SMA?
EMA reacts faster because recent prices receive more weight. SMA gives equal weight to every price in the lookback period, so it usually changes more slowly.
What are the limitations of EMA?
EMA lags, depends only on historical price, and can create weak readings in range-bound markets. Shorter EMAs are more responsive, but they can also react more often to noise.
Does EMA predict price direction?
No. EMA smooths historical price with extra weight on recent data. It can describe recent pressure, but it does not predict future price direction or prove that a trend will continue.