The Aroon Indicator is a bounded trend indicator that compares how recently price made its highest high and lowest low inside a selected lookback window. It uses two lines, Aroon Up and Aroon Down, to show whether the most recent extreme is close to the current bar or farther back in the measured period.
The important boundary is that Aroon reads recency, not magnitude. A high Aroon Up value means the highest high happened recently, but it does not prove that price moved far, that volume supported the move, or that the broader structure accepted a new trend.
Key Points
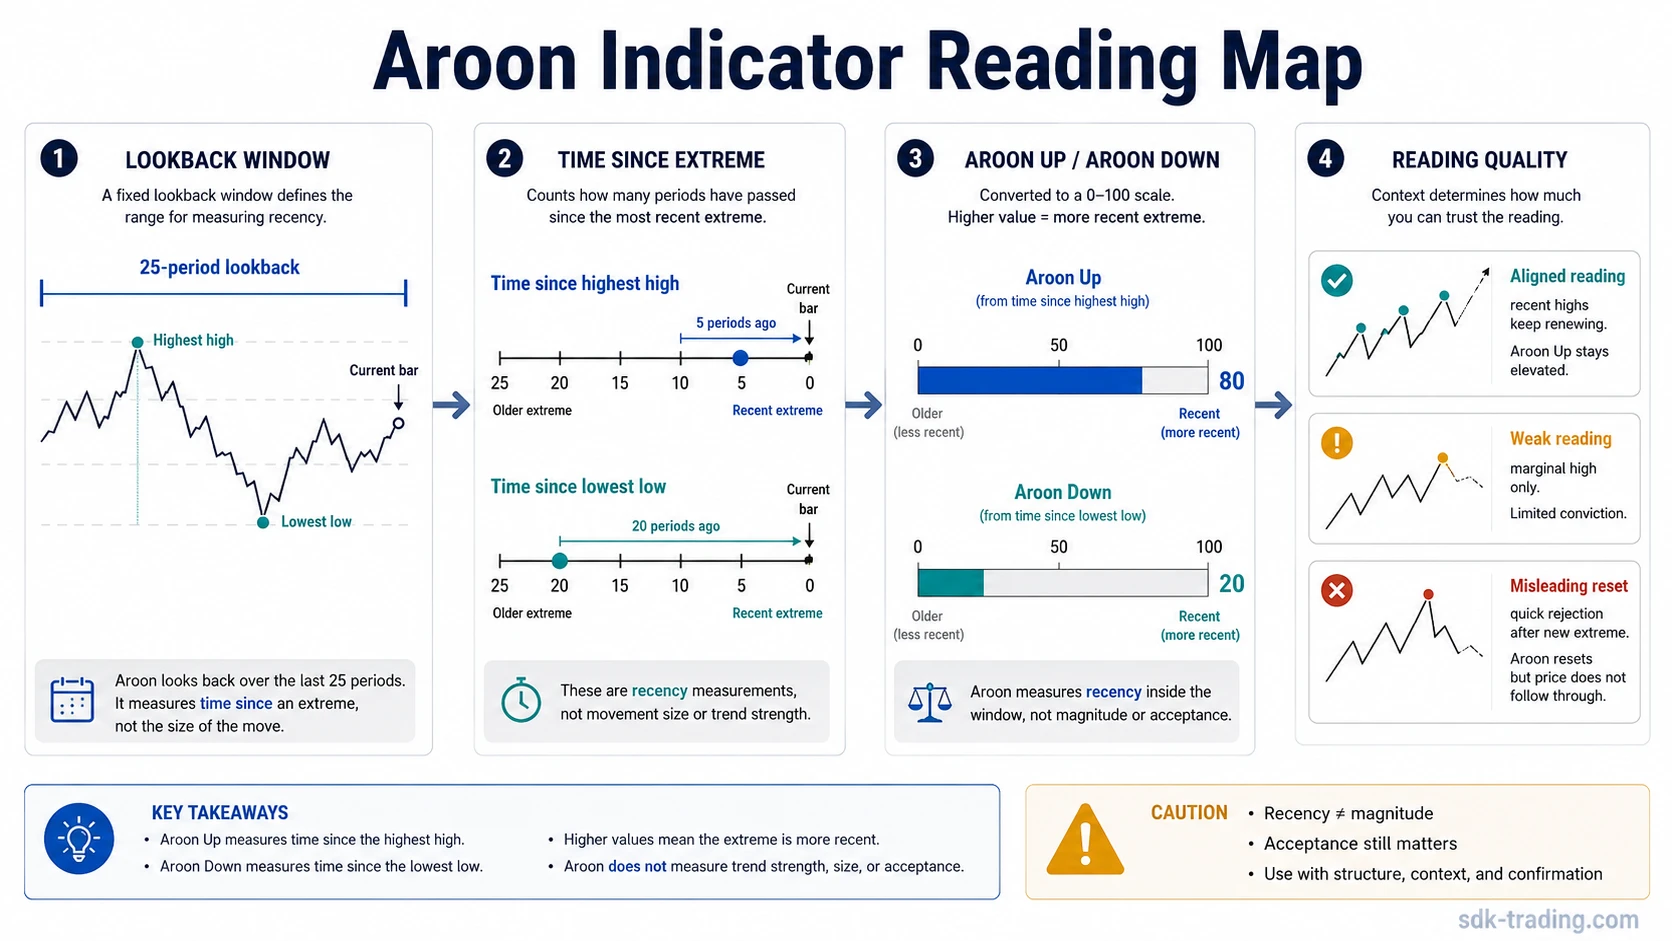
- Aroon uses two lines: Aroon Up for recent highs and Aroon Down for recent lows.
- Both lines are measured inside a fixed lookback window and range from 0 to 100.
- High values show that the relevant high or low occurred recently within the lookback.
- Aroon measures time since an extreme, not the size or quality of the price move.
- Choppy ranges and marginal new highs or lows can create misleading resets.
What Is the Aroon Indicator?
Aroon Indicator definition: The Aroon Indicator is a technical indicator that measures how much time has passed since the highest high and lowest low within a chosen lookback period.
The indicator is usually plotted as two lines. Aroon Up tracks the recency of the highest high. Aroon Down tracks the recency of the lowest low. The closer the relevant extreme is to the current bar, the higher the corresponding Aroon value will be.
This makes Aroon different from many trend tools that smooth price or average prior values. It does not ask how far price moved from one point to another. It asks whether a new high or new low has appeared recently enough to keep one side of the reading elevated.
How Aroon Up and Aroon Down Work
Aroon Up rises when the highest high in the lookback period is recent. If the highest high occurred on the most recent bar, Aroon Up is near the top of its range. If the highest high occurred many bars ago, Aroon Up falls as that high becomes older inside the window.
Aroon Down works the same way for the lowest low. A recent lowest low pushes Aroon Down higher. A low that happened far back in the lookback period creates a lower Aroon Down value.
| Line | What it tracks | High reading means | Low reading means |
|---|---|---|---|
| Aroon Up | Time since the highest high in the lookback | The highest high occurred recently | The highest high is older inside the window |
| Aroon Down | Time since the lowest low in the lookback | The lowest low occurred recently | The lowest low is older inside the window |
The two lines are not measuring bullish or bearish pressure directly. They are measuring which side of the lookback window has produced the more recent structural extreme.
Aroon Formula and Lookback Window
The standard Aroon calculation uses a predetermined number of periods. A common lookback is 25 periods, but the logic is the same with any selected length.
Aroon Up = ((lookback periods – periods since highest high) / lookback periods) x 100
Aroon Down = ((lookback periods – periods since lowest low) / lookback periods) x 100
If the highest high occurred very recently, the “periods since highest high” part of the formula is small, so Aroon Up is high. If that high occurred near the beginning of the lookback, the value falls.
The lookback length controls sensitivity. A shorter lookback reacts faster because highs and lows enter or leave the window more quickly. A longer lookback reacts more slowly because the indicator holds a wider set of prior bars in view.
Lookback sensitivity note: Changing the length does not make Aroon more or less “correct” by itself. It changes how quickly the reading resets when a new high or low appears.
How to Read Aroon Values
Aroon values run from 0 to 100. A high value shows that the relevant extreme occurred recently. A low value shows that the relevant extreme is older within the selected lookback.
| Aroon reading | Basic interpretation | Important limitation |
|---|---|---|
| Near 100 | The relevant high or low occurred very recently | Does not prove the move was large or accepted |
| Above 50 | The relevant extreme is in the more recent half of the lookback | May still be weak if the extreme is marginal or quickly rejected |
| Around 50 | The relevant extreme is near the midpoint of the lookback | Often less informative unless line separation is clear |
| Below 50 | The relevant extreme is older in the lookback | May reflect time decay rather than a fresh opposite move |
| Near 0 | The relevant high or low is far back in the lookback | Does not automatically mean the opposite trend is strong |
Line separation is usually more informative than one value by itself. If Aroon Up remains elevated while Aroon Down stays low, the lookback has been renewing highs more recently than lows. If Aroon Down remains elevated while Aroon Up stays low, recent lows are dominating the measured window.
What Aroon Shows in Trends and Ranges
In a directional advance, Aroon Up can stay elevated because new highs keep appearing within the lookback. Aroon Down may remain lower if the lowest low is farther back. In a directional decline, the opposite condition can appear: Aroon Down stays elevated while Aroon Up decays.
In a range, the reading can become less stable. Price may alternate between small new highs and small new lows without building a clean directional structure. That can make Aroon Up and Aroon Down cross or reset frequently.
| Observed Aroon behavior | What it can describe | What it does not prove |
|---|---|---|
| Aroon Up high, Aroon Down low | Recent highs are renewing faster than recent lows | That trend strength is confirmed |
| Aroon Down high, Aroon Up low | Recent lows are renewing faster than recent highs | That downside continuation is guaranteed |
| Both lines low or falling | Neither the highest high nor lowest low is very recent | That a breakout or reversal is imminent |
| Frequent line crosses | The lookback may be resetting from both sides | That each cross has directional meaning |
When Aroon Gives a Weak or Misleading Reading
Aroon can look strong when the underlying price behavior is weak. The most common reason is a marginal reset. If price prints a small new high inside the lookback window, Aroon Up can jump near the top of the range even if the move barely clears the prior high and fails to hold above the earlier range.
That reading is mechanically correct. The highest high did occur recently. The problem is interpretation: recency is not the same as magnitude, acceptance, or trend quality.
Weak reading boundary: A high Aroon Up value is weaker when the new high is marginal, quickly rejected, or surrounded by overlapping price action. A high Aroon Down value is weaker when the new low is only a brief probe below a range and price quickly reclaims the prior area.
Aroon also ignores volume and volatility. A reset can happen on a thin move, during a noisy range, or in a market where price is still rotating around the same broader zone. The indicator can show that a new extreme happened recently, but it cannot decide whether that extreme changed the structure.
Aroon Indicator Example in Context
A market trades sideways for several sessions, with repeated highs forming near the same upper area. Price then pushes slightly above that area and creates the highest high in the current lookback. Aroon Up may reset near 100 because the highest high is now recent.
If price immediately falls back into the prior range and the next recovery attempt stalls below the same upper area, the Aroon reading has not become false mathematically. It has become weaker as a directional interpretation. The indicator captured the timing of the new high, while the price behavior failed to show strong acceptance beyond the range.
This is why the reading is clearer when it stays tied to time since the latest extreme. Aroon can identify fresh highs and lows inside the lookback, but the quality of those extremes still has to be judged through price behavior around the tested area.
Aroon vs ADX and Moving Average Indicators
Aroon and ADX are often grouped as trend indicators, but they answer different questions. Aroon measures how recently highs and lows occurred. ADX measures trend strength or intensity from directional movement. A high Aroon value can appear because a recent extreme occurred, while ADX is built around the strength of directional movement rather than the timing of the latest high or low.
Aroon also differs from smoothing-based tools. A moving average such as the EMA averages price over time, while Aroon focuses on the position of the most recent high and low inside the lookback. That means Aroon can reset sharply when a new extreme appears, while smoothing tools usually change more gradually.
The same distinction applies to smoother indicator families such as ALMA-style smoothing. Aroon is not trying to smooth trend direction. It is asking how recently the market printed the highest high or lowest low in the chosen window.
Common Mistakes When Reading Aroon
| Mistake | Why it happens | Safer reading |
|---|---|---|
| Treating high Aroon Up as trend strength | The line rises when a high is recent | Separate recency from magnitude and acceptance |
| Reading every line cross as meaningful | Crosses can appear often in ranges | Check whether price is renewing extremes or only rotating |
| Ignoring the lookback length | Different lengths reset at different speeds | Interpret the reading relative to the selected window |
| Comparing Aroon directly to smoothing tools | Both can be called trend indicators | Remember that Aroon measures time since extremes, not average price direction |
The cleanest use of Aroon is descriptive. It can show whether highs or lows are being renewed inside the lookback window. It becomes less reliable when the reader treats that renewal as proof that the market has already accepted a stronger directional move.
FAQ
What does the Aroon indicator measure?
The Aroon indicator measures how recently price made the highest high and lowest low within a selected lookback period. Aroon Up tracks the recent high side, while Aroon Down tracks the recent low side.
How is the Aroon indicator calculated?
Aroon Up is calculated as ((lookback periods – periods since the highest high) / lookback periods) x 100. Aroon Down uses the same formula with periods since the lowest low.
What does a high Aroon Up value mean?
A high Aroon Up value means the highest high in the lookback occurred recently. It does not automatically mean the trend is strong, accepted, or supported by volume.
How is Aroon different from ADX?
Aroon measures the recency of highs and lows inside a lookback window. ADX measures trend strength or intensity from directional movement, so the two indicators answer different questions.
Bottom Line
The Aroon Indicator is clearest when it is treated as a recency map. It shows whether the latest high or low happened recently inside the lookback window. Its main weakness appears when a small new extreme resets the line but price does not show meaningful acceptance beyond the prior range.