The ALMA indicator, or Arnaud Legoux Moving Average, is a technical-analysis moving average that smooths price with Gaussian weighting. Its behavior is shaped by window length, offset, and sigma, which change how the line balances smoothness, responsiveness, and lag.
Definition: The ALMA indicator is a Gaussian-weighted moving average that smooths price inside a selected lookback window. It can show smoothed price behavior and line curvature, but it does not predict price direction or define a trading decision.
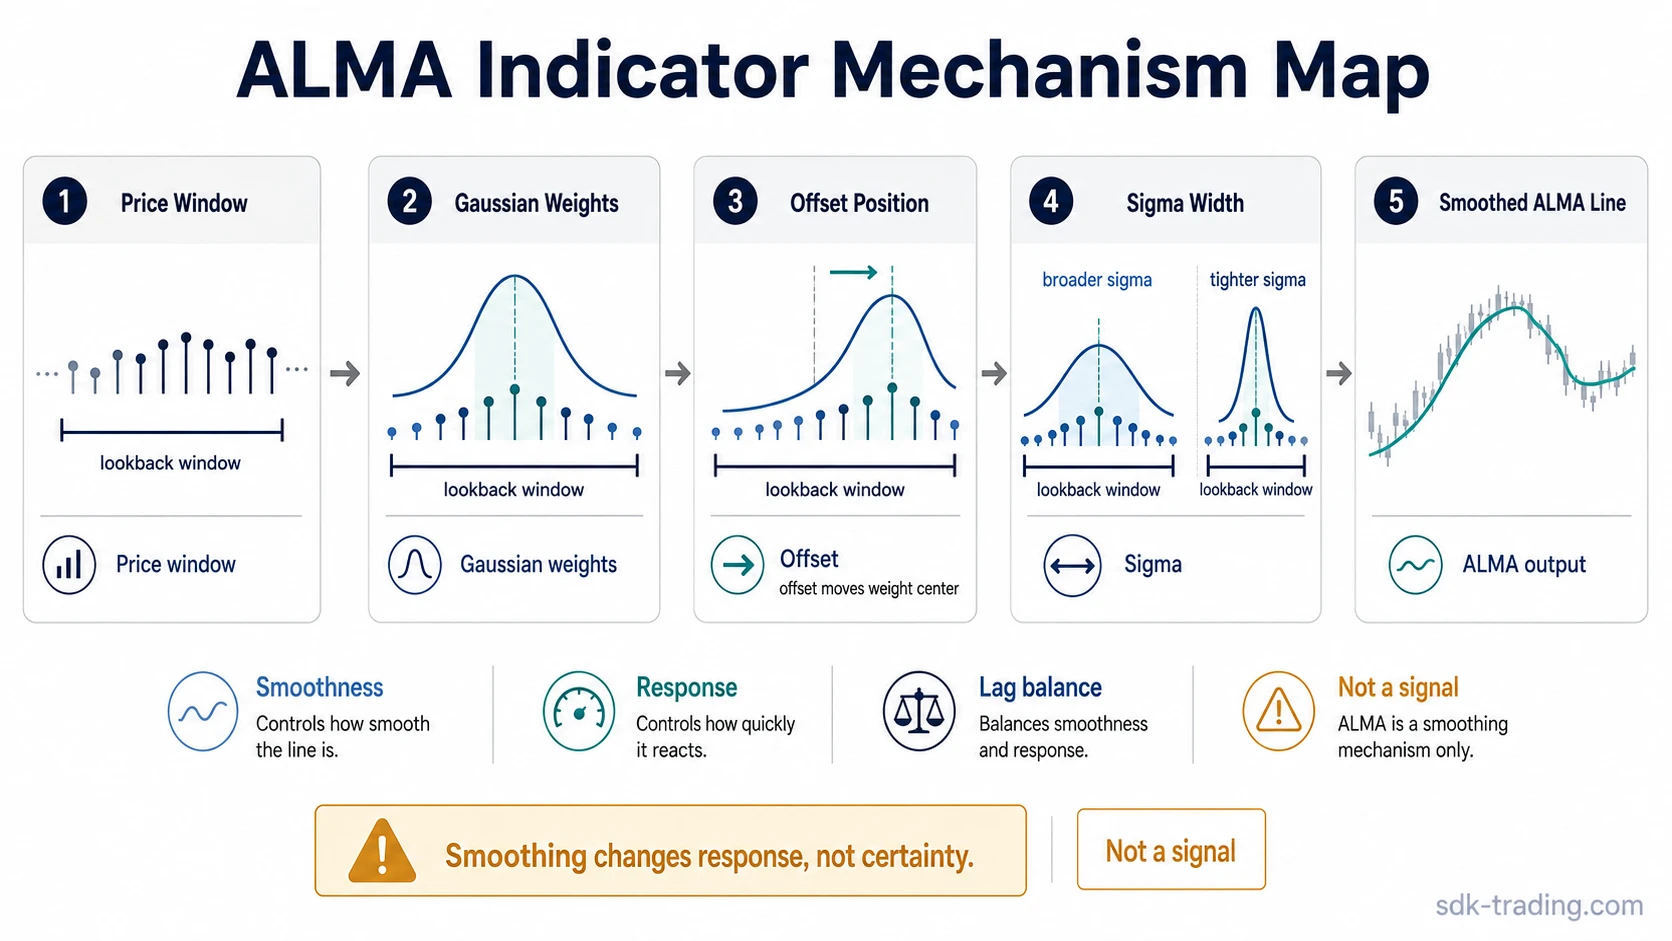
ALMA differs from a simple moving average because it does not treat every bar in the lookback window equally. It places a weighting curve inside the window, then uses offset and sigma to control where that weight is centered and how concentrated it should be.
The useful reading is the smoothing mechanism. ALMA can reduce visual noise, but it cannot remove uncertainty, define risk, or prove that a price move has been confirmed.
Key Points
- ALMA stands for Arnaud Legoux Moving Average.
- It is a Gaussian-weighted moving average used in technical analysis.
- Window length, offset, and sigma control how smooth, fast, or sensitive the line appears.
- ALMA redistributes the lag-and-noise trade-off; it does not remove lag completely.
- A price cross, slope change, or line position needs broader market context before it carries useful meaning.
What Is the ALMA Indicator?
The ALMA indicator is a moving-average indicator designed to smooth price while giving more control over how smoothing weight is positioned inside the lookback window. Its full name is Arnaud Legoux Moving Average.
A basic moving average smooths price by averaging a selected number of bars. ALMA adds a more specific weighting structure. It uses a Gaussian-style curve, then lets the offset and sigma settings adjust how the curve behaves inside the selected window.
This makes ALMA a smoothing tool rather than a full market interpretation. It can make price movement easier to read, but the line still needs price structure, volatility context, and risk definition before it becomes useful in a broader decision process.
How the Arnaud Legoux Moving Average Works
ALMA works by assigning different weights to recent price values. The strongest weight is placed around a selected point inside the lookback window, and prices farther from that point receive less influence.
| Step | Calculation idea | Interpretation boundary |
|---|---|---|
| Lookback window | Selects the group of recent bars included in the calculation | The sample size affects smoothness and reaction speed |
| Gaussian weighting | Assigns more weight near the selected center of the window | The line reflects weighted smoothing, not proof of direction |
| Offset | Moves the weighting center toward a different part of the window | A more recent bias can react faster, but it does not remove lag |
| Sigma | Controls how wide or concentrated the weighting curve is | Extreme settings can make the line too noisy or too slow |
| Weighted average | Adds the weighted price values and normalizes by total weight | The output is a smoothed line, not a complete market message |
The important point is that ALMA changes where price influence sits inside the calculation window. It changes the smoothing response; it does not create certainty.
ALMA Calculation in Plain Language
A compact way to understand ALMA is that it creates a weighted average of recent prices, where the weights follow a Gaussian curve inside the lookback window.
Formula idea: ALMA multiplies each price in the selected window by a Gaussian weight, adds those weighted values together, and divides by the total weight. Offset changes where the weight is centered, while sigma changes how tightly that weight is distributed.
This is why two ALMA lines can behave differently on the same chart. A different window, offset, sigma, or price source can change the line’s smoothness, curvature, and responsiveness.
ALMA Parameters: Window, Offset, and Sigma
ALMA is parameter-sensitive. The same indicator can look smooth, fast, delayed, or noisy depending on how the settings are configured.
| ALMA component | What it controls | Interpretation boundary |
|---|---|---|
| Window / length | How many bars are included in the moving-average calculation | Longer windows usually smooth more but react slower; shorter windows react faster but can echo noise |
| Offset / shift | Where the Gaussian weight is centered inside the lookback window | A higher offset can bias the line toward recent prices, but it does not remove lag or prove direction |
| Sigma / deviation | The width or concentration of the Gaussian weighting curve | Sigma changes smoothness and curvature; extreme values can make the line too sensitive or too slow |
| Price source | Which price input is averaged, depending on platform settings | Changing the input changes the plotted line; it does not create confirmation by itself |
Window length controls how much price history enters the calculation. A longer window usually makes the line smoother, while a shorter window can react faster and bend around ordinary price rotation.
Offset shifts where the Gaussian weight is centered inside the lookback window. A recent-price bias can make ALMA look more responsive, but the safer reading is that offset redistributes lag rather than removes it.
Sigma controls how concentrated the weighting curve is. A tighter curve gives more influence to prices near the weighting center, while a broader curve spreads influence across more of the window.
Limitation: A sensitive ALMA can echo noise, while a very smooth ALMA can hide abrupt transitions. The parameter set changes the smoothing balance; it does not solve the uncertainty behind price movement.
ALMA vs SMA, EMA, and HMA
ALMA belongs to the moving-average family, but it uses a different weighting structure from SMA, EMA, and HMA.
| Moving average | Main weighting idea | How it differs from ALMA |
|---|---|---|
| SMA | Equal weight across the selected window | SMA treats each bar equally; ALMA uses a Gaussian weighting curve |
| EMA | Exponential emphasis on recent prices | EMA weights recent prices directly; ALMA positions a Gaussian curve inside the window |
| HMA | Lag-reduction construction using weighted recombination | HMA uses a different construction method; ALMA relies on offset and sigma inside a Gaussian model |
ALMA is not automatically better than these averages. Its distinct feature is that the smoothing weight can be shaped by a Gaussian model, offset, and sigma.
What ALMA Can and Cannot Tell You
ALMA can show price after a specific smoothing model has been applied. It may make direction, curvature, and line behavior easier to see than raw price alone.
ALMA cannot measure trend strength. A smoothed line can rise while broader price structure remains weak, compressed, or unresolved. ADX is designed around trend-strength interpretation, while ALMA is a smoothing average.
Aroon-style tools focus on the timing relationship between recent highs and lows. ALMA focuses on weighted price smoothing inside a selected window. That difference matters because a smoothing line and a trend-timing tool answer different questions.
Some traders also treat moving averages as visual reference areas. ALMA can play that role, but a reaction near the line does not prove that the line caused the reaction. Price may be responding to broader structure, volatility compression, prior highs or lows, or mean reversion.
Important boundary: ALMA changes how price is smoothed. It does not verify the broader market condition on its own.
When ALMA Can Mislead
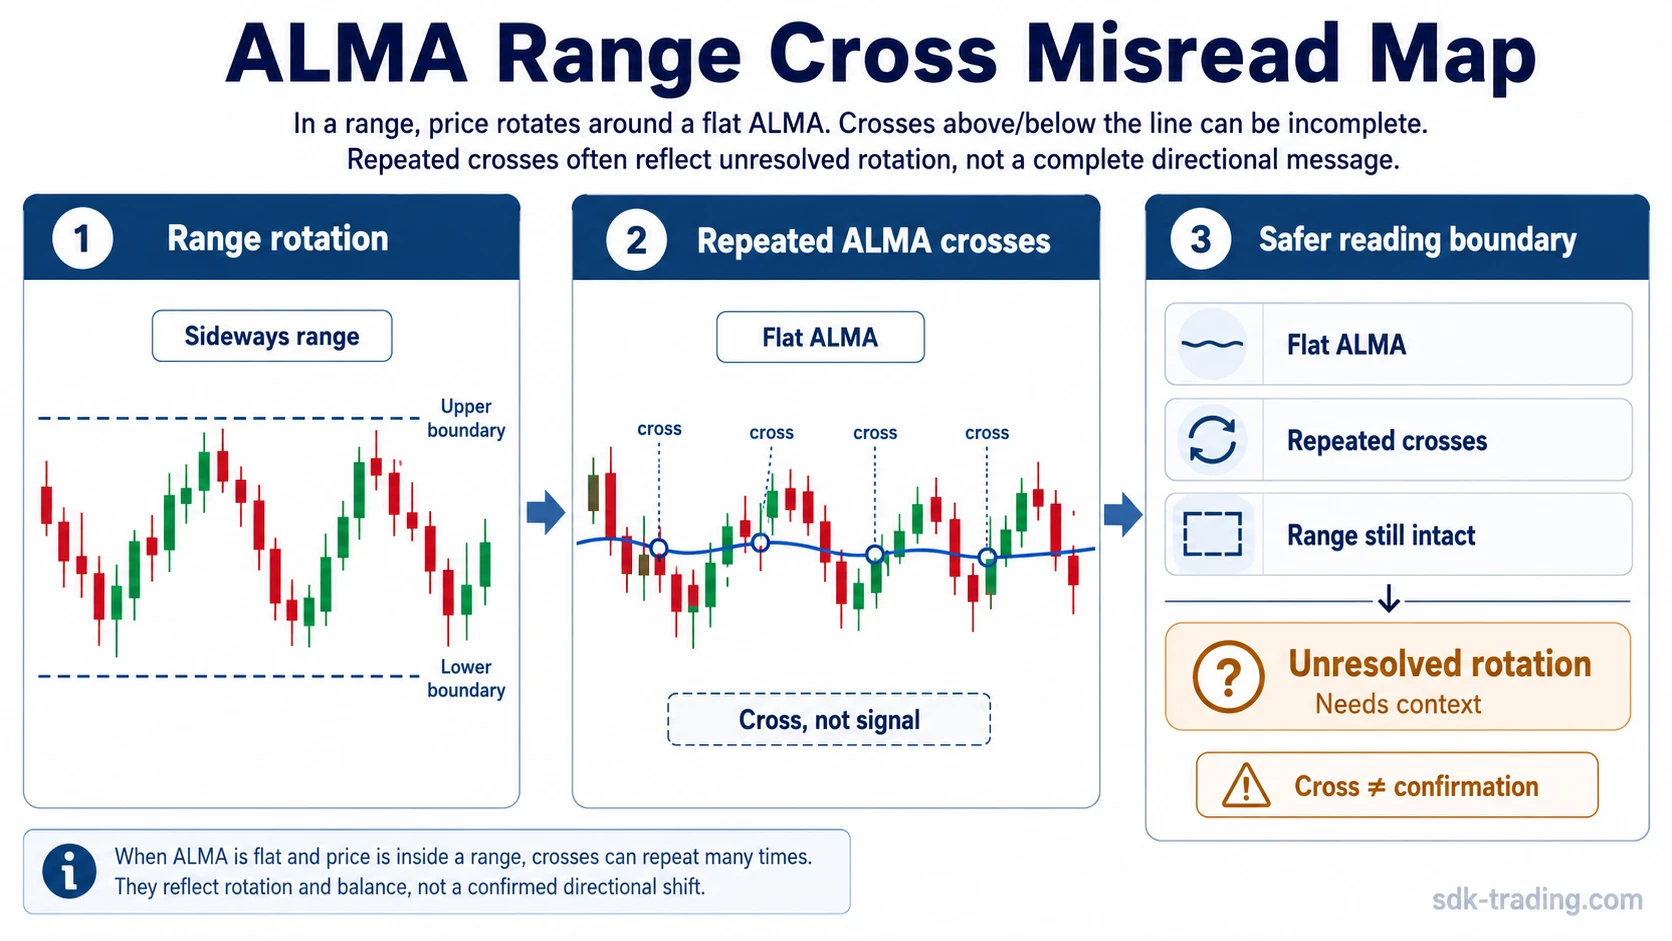
ALMA can mislead when the market rotates sideways, when price repeatedly crosses the line, or when parameters are fitted too closely to a past chart.
| Misread condition | Observable behavior | Why it can mislead | Safer interpretation |
|---|---|---|---|
| Range-bound market | Price moves above and below ALMA while the line stays flat | The line may describe rotation rather than direction | Treat repeated crosses as unresolved until structure changes |
| Repeated line crosses | Price crosses ALMA several times in a short period | The market may be noisy rather than directional | Check whether price is expanding or still rotating |
| Abrupt transition | Price moves quickly before ALMA clearly bends | Smoothing can delay visual recognition of the transition | Do not treat the line as early confirmation |
| Parameter overfitting | A setting looks clean only after being tuned to a past chart | The same setting may not behave well under new conditions | Read settings as sensitivity choices, not proof of reliability |
The line is not wrong simply because it becomes unclear. In many range conditions, ALMA may be showing that price is rotating around a smoothed average rather than building clean directional separation.
Common ALMA Misunderstanding
The most common misunderstanding is treating ALMA as a complete market message. A price cross, slope change, or line position is only an observation. It shows how price relates to one smoothed calculation.
Common mistake: A cross above or below ALMA does not automatically resolve direction. The calculation layer shows smoothing behavior; the interpretation layer still depends on structure, volatility, range conditions, and risk definition.
The mistake is collapsing those layers into one answer. ALMA is useful only when the calculation, interpretation, and context layers stay separate.
ALMA Range Misread Scenario
Price rotates between the same upper and lower areas for several sessions. It crosses above the ALMA line, falls back below it, and then crosses again while the line remains mostly flat.
Each cross can look meaningful in isolation. A cleaner reading is that price is rotating around a smoothing line and has not yet shown clean directional separation.
The condition becomes clearer only when price expands away from the range, the ALMA slope becomes more consistent, and broader structure supports the same interpretation.
FAQ
What does ALMA stand for?
ALMA stands for Arnaud Legoux Moving Average. In trading and technical analysis, it refers to a Gaussian-weighted moving average indicator.
Is ALMA a lagging indicator?
ALMA is based on historical price data, so it cannot fully escape lag. Its offset and sigma settings can change how lag and smoothness appear, but they do not remove uncertainty.
Is ALMA a trading strategy?
No. ALMA is an indicator, not a complete trading strategy. It can help smooth price behavior, but it does not define risk, market context, or confirmation on its own.