The ADX indicator, or Average Directional Index, is a trading indicator that measures trend strength, not price direction. Directional context comes from the +DI and -DI lines, while ADX shows whether directional movement is becoming more persistent or losing force.
Definition: The ADX indicator is a smoothed trend-strength line from Wilder’s Directional Movement System. It helps classify whether a market is trending, ranging, or producing unclear directional movement, but it does not identify bullish or bearish direction by itself.
ADX gives clearer information when the strength line is separated from directional interpretation. A rising ADX can appear during an advance or a decline. A low or flat ADX often points to weaker trend persistence, especially when +DI and -DI keep crossing inside a choppy range.
Thresholds such as 20 or 25 are best treated as trend-strength classification zones, not as entries, exits, or directional confirmation.
Key Points
- ADX measures the strength or persistence of directional movement, not whether price is bullish or bearish.
- +DI and -DI provide directional context; ADX summarizes how strong that directional movement is becoming.
- Common thresholds such as 20, 25, and very high readings are interpretation zones, not trade triggers.
- ADX can lag because it is smoothed, so high readings may describe an already-developed trend.
- Repeated +DI/-DI crosses with low or flat ADX often point to range-market noise rather than a clean trend condition.
What Is the ADX Indicator?
The ADX indicator is a technical analysis tool used to judge whether directional movement has enough strength to be treated as a trend condition. It does not say whether buyers or sellers are in control. That directional information comes from the related +DI and -DI lines.
A simple way to read the relationship is that +DI and -DI describe directional pressure, while ADX describes the quality of that pressure. If +DI is above -DI and ADX is rising, bullish directional movement may be gaining persistence. If -DI is above +DI and ADX is rising, bearish directional movement may be gaining persistence. In both cases, ADX is measuring strength, not choosing direction.
The ADX indicator belongs to the broader family of trend indicators, but it behaves differently from moving averages. A moving average such as ALMA smooths price itself, while ADX smooths directional movement into a strength reading.
ADX Classification: What It Measures and What It Does Not Measure
| ADX element | What it measures | What it does not measure | Best use | Weak use |
|---|---|---|---|---|
| ADX line | Trend strength and persistence | Bullish or bearish direction | Classifying trend quality | Calling direction from ADX alone |
| +DI line | Positive directional movement | Trend strength by itself | Adding bullish directional context | Treating every cross as a standalone signal |
| -DI line | Negative directional movement | Trend strength by itself | Adding bearish directional context | Treating every cross as a standalone signal |
| DMI group | Directional movement structure | Guaranteed continuation | Separating direction from strength | Ignoring price structure and market regime |
The classification matters because ADX is often misread as a directional indicator. A rising line does not automatically mean bullish pressure. It means the directional movement already present in the market is becoming more persistent.
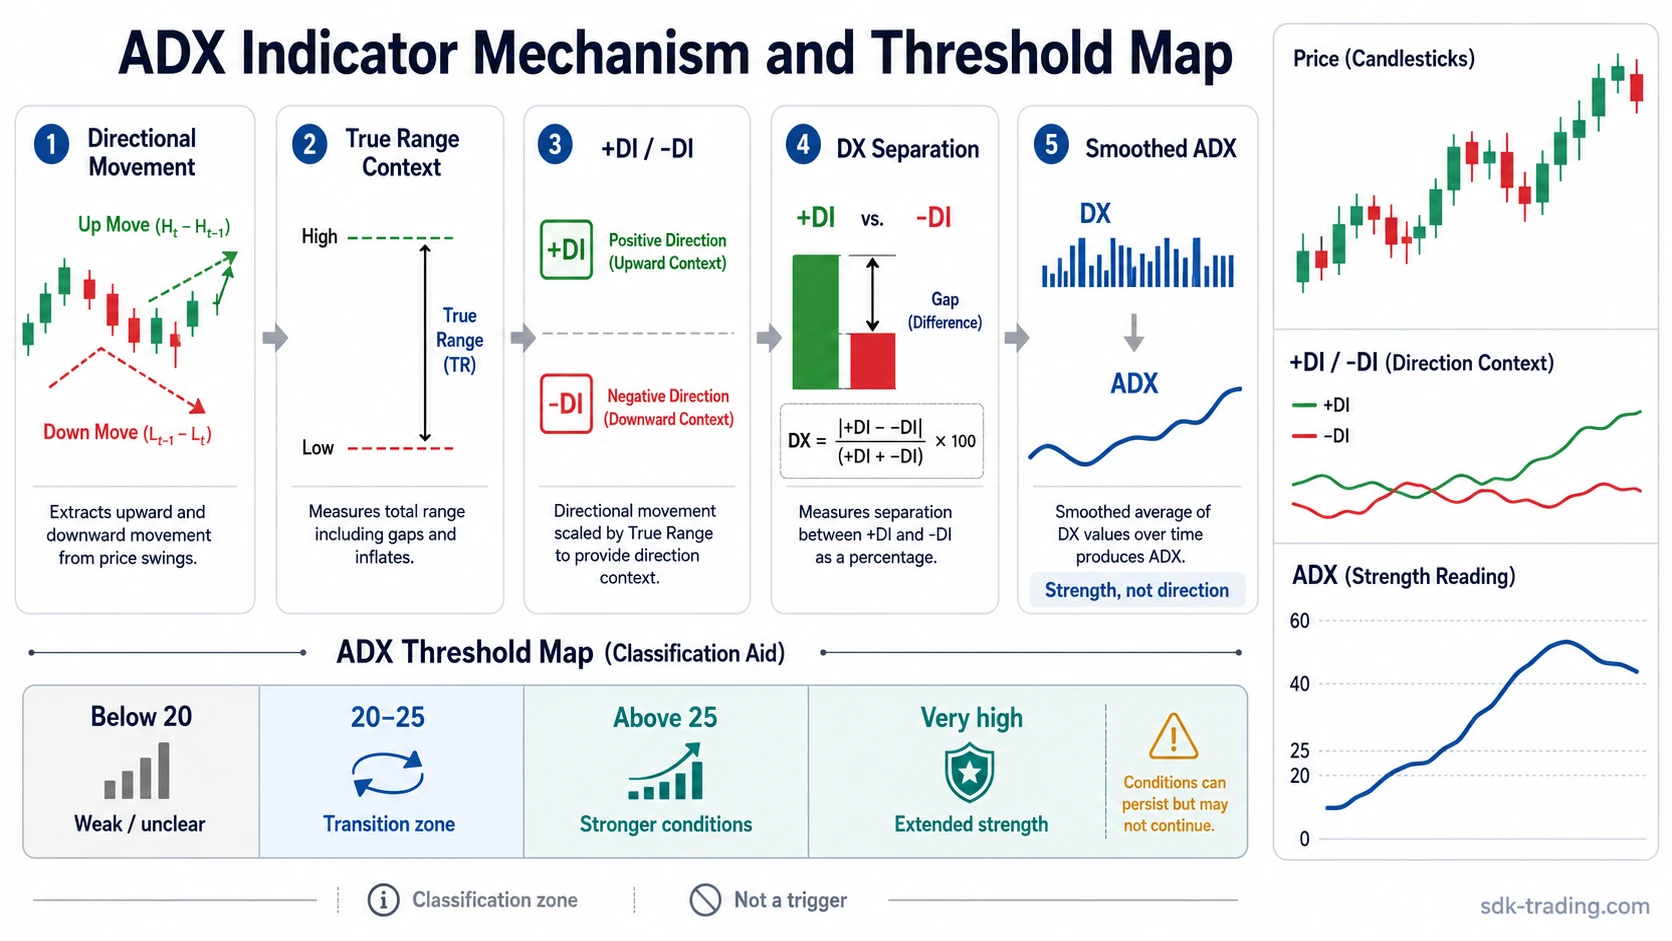
How ADX Is Calculated
ADX is usually explained through a sequence rather than one isolated formula. The calculation begins with directional movement, compares that movement with true range, converts the result into +DI and -DI, then smooths the difference between them into the ADX line.
| Step | Calculation idea | Interpretation boundary |
|---|---|---|
| Directional movement | Compares current highs and lows with the prior period | Separates positive and negative movement, but does not yet classify trend quality |
| True range normalization | Relates directional movement to the market’s range | Prevents raw price movement from being read without volatility context |
| +DI and -DI | Creates directional lines from positive and negative movement | Shows directional pressure, not complete confirmation |
| DX | Measures the distance between +DI and -DI relative to their sum | Captures directional separation before smoothing |
| ADX smoothing | Smooths DX into a trend-strength line | Improves readability but adds lag |
The smoothing step is important. ADX can remain elevated after the cleanest part of a move has already passed. A high line may describe trend persistence, but it should not be treated as proof that a fresh move is beginning.
How to Read ADX Thresholds
ADX thresholds are common interpretation ranges, not universal laws. They help classify trend-strength conditions, but the line still needs price structure, directional-line behavior, and market context.
| ADX area | Common interpretation | What it does not prove | Risk of misread |
|---|---|---|---|
| Below 20 | Weak or unclear trend strength | That price cannot move | Ignoring early transitions before ADX responds |
| 20-25 | Transition or gray zone | That a confirmed trend is already established | Forcing a trend label too early |
| Above 25 | Stronger trend conditions may be present | That direction is bullish or bearish | Treating the threshold as an entry trigger |
| Very high readings | Strong trend persistence or extended directional movement | That continuation is guaranteed | Reading strength after the move is already mature |
A threshold becomes more informative when it agrees with directional-line separation and price expansion. It remains unresolved when ADX crosses a threshold but price is still trapped in the same range or the directional lines keep reversing.
ADX, +DI, and -DI
ADX should be read together with +DI and -DI because the three lines answer different questions. ADX asks whether directional movement is strong. +DI and -DI ask which side has more directional pressure.
When +DI is above -DI, positive directional movement is stronger than negative directional movement. When -DI is above +DI, negative directional movement is stronger than positive directional movement. ADX then helps judge whether that separation is becoming persistent or fading into noise.
Important boundary: A +DI/-DI crossover is not a complete trading message. In a range, the two lines can cross repeatedly while ADX stays low or flat, creating directional noise without a clean trend-strength condition.
Clean, Weak, and Invalid ADX Readings
The strongest ADX classifications combine directional separation, trend-strength expansion, and price behavior that supports the same interpretation. Weak conditions usually appear when one part of that chain is missing.
| Reading type | Observable behavior | Interpretation | What still needs caution |
|---|---|---|---|
| Clean ADX reading | ADX rises while +DI and -DI separate and price expands away from a prior range | Trend strength may be improving in the direction shown by the dominant DI line | ADX can still lag if the move is already mature |
| Weak ADX reading | ADX stays low or flat while +DI and -DI cross repeatedly | Directional movement is not persistent enough for a clean trend-strength classification | Early trend transitions can appear messy before strength develops |
| Invalid or misread ADX reading | ADX rises, but direction is inferred from ADX alone or a threshold is used as a trigger | The interpretation confuses strength with direction or classification with action | Price structure and directional context may contradict the assumption |
A clean classification is not the same as certainty. ADX only improves the interpretation of trend strength. It still works best as one part of combining indicators with price structure, volatility, volume, or other context that answers a different question.
Where ADX Becomes Less Useful
ADX becomes less reliable when the market rotates inside a range and directional movement does not persist. In that environment, +DI and -DI may flip back and forth while ADX remains low, delayed, or inconsistent.
Limitation: ADX is smoothed, so it can respond after the market has already moved. A rising line can describe an established trend rather than a new opportunity, and a low line can remain low during the early part of a developing move.
The most common ADX mistake is treating one threshold as a complete answer. A line above 25 may support a trend-strength interpretation, but it does not identify direction, timing, risk, or whether price has already traveled too far for the condition to remain useful.
ADX vs Nearby Trend Indicators
ADX differs from trend indicators that smooth price or track the timing of highs and lows. Moving-average tools focus on price smoothing and slope. Aroon-style tools focus on how recently price has made highs or lows. ADX focuses on whether directional movement has become strong enough to describe trend persistence.
That distinction keeps ADX useful as a classification tool. It can help separate a quiet range from a stronger directional condition, but it should not replace indicators or chart evidence designed to answer direction, location, or timing questions.
Different indicator groups answer different market questions; best trading indicators separates trend-strength tools from momentum, volatility, volume, and price-smoothing tools.
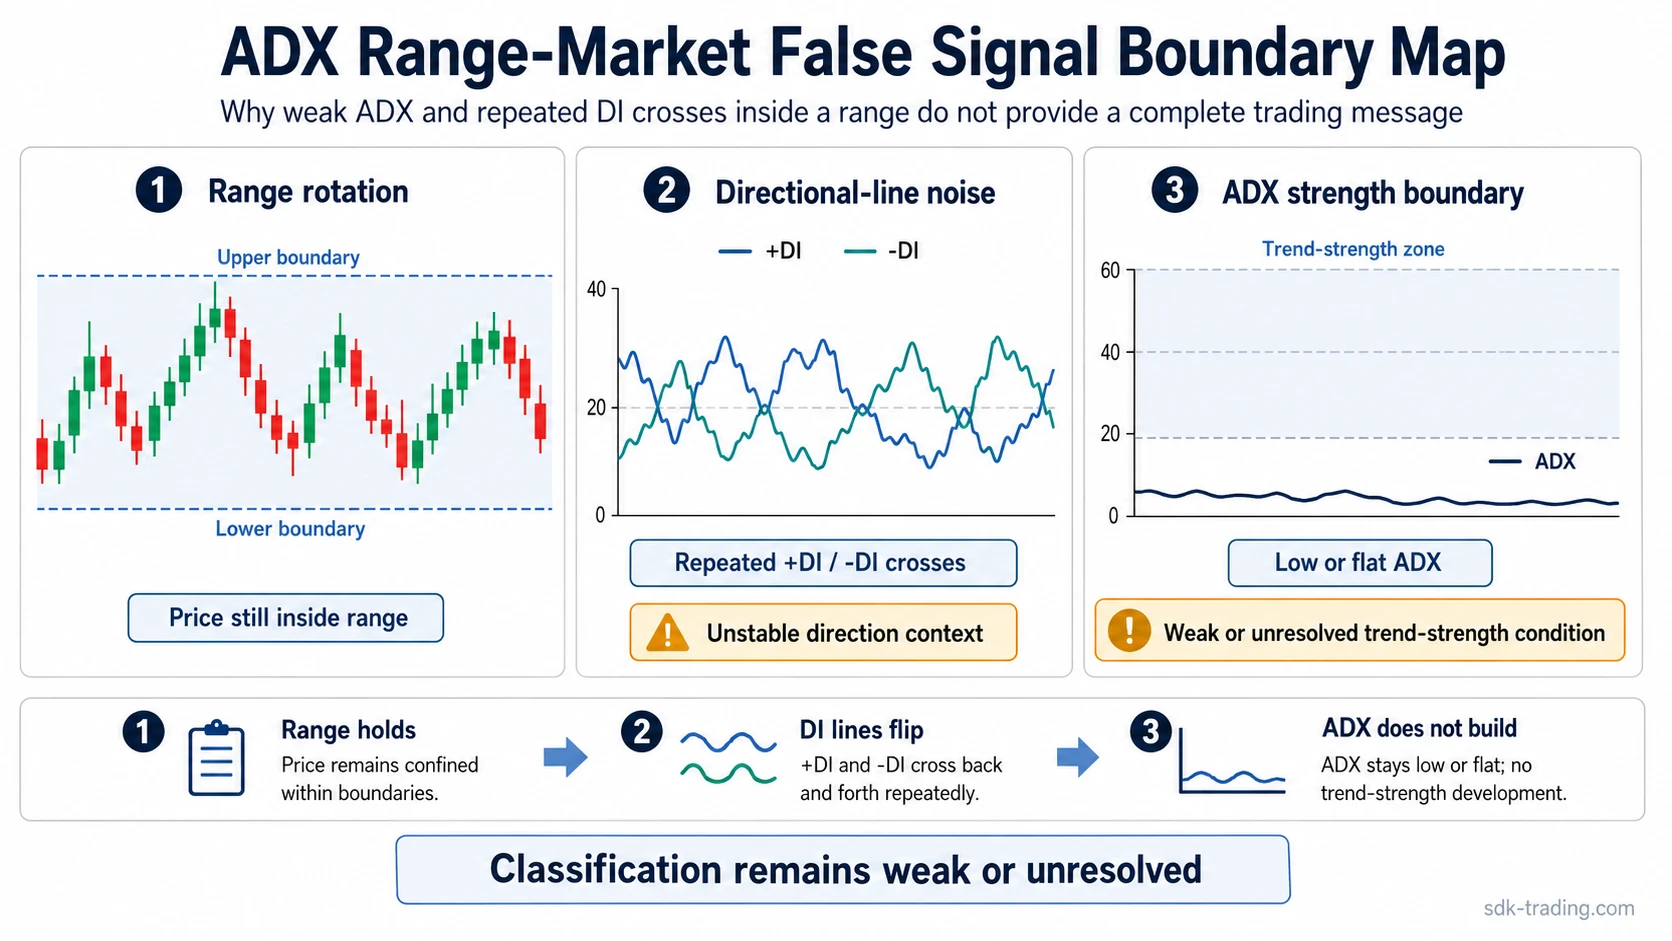
Practical ADX Misread Scenario
Price rotates between the same upper and lower areas for several sessions. +DI moves above -DI near the top of the range, then -DI moves back above +DI after price rejects the same area. ADX stays below the usual trend-strength zone and does not build a clear upward slope.
The tempting read is to treat each directional-line cross as a new message. The stronger interpretation is that directional pressure is unstable. ADX is not confirming persistence, and the range structure is still controlling the behavior.
The condition would improve only if price expanded away from the range, the directional lines separated more cleanly, and ADX began rising with that expansion. Without that sequence, the ADX condition remains weak or unresolved rather than directional confirmation.
FAQ
What does the ADX indicator measure?
The ADX indicator measures trend strength. It does not measure bullish or bearish direction by itself. Directional context comes from the +DI and -DI lines.
Does a rising ADX mean price is bullish?
No. A rising ADX means directional movement is becoming stronger or more persistent. The direction depends on price behavior and the relationship between +DI and -DI.
What is a strong ADX reading?
Many traders treat readings above 25 as a sign that stronger trend conditions may be present, but the threshold is only a classification zone. It does not provide direction or timing by itself.
Why can ADX give misleading readings in a range?
In a range, +DI and -DI can cross repeatedly while ADX stays low, flat, or delayed. That behavior often reflects unstable directional pressure rather than a clean trend.
Is ADX a trading strategy?
ADX is an indicator, not a complete strategy. It can help classify trend strength, but it does not define entries, exits, risk, or confirmation on its own.