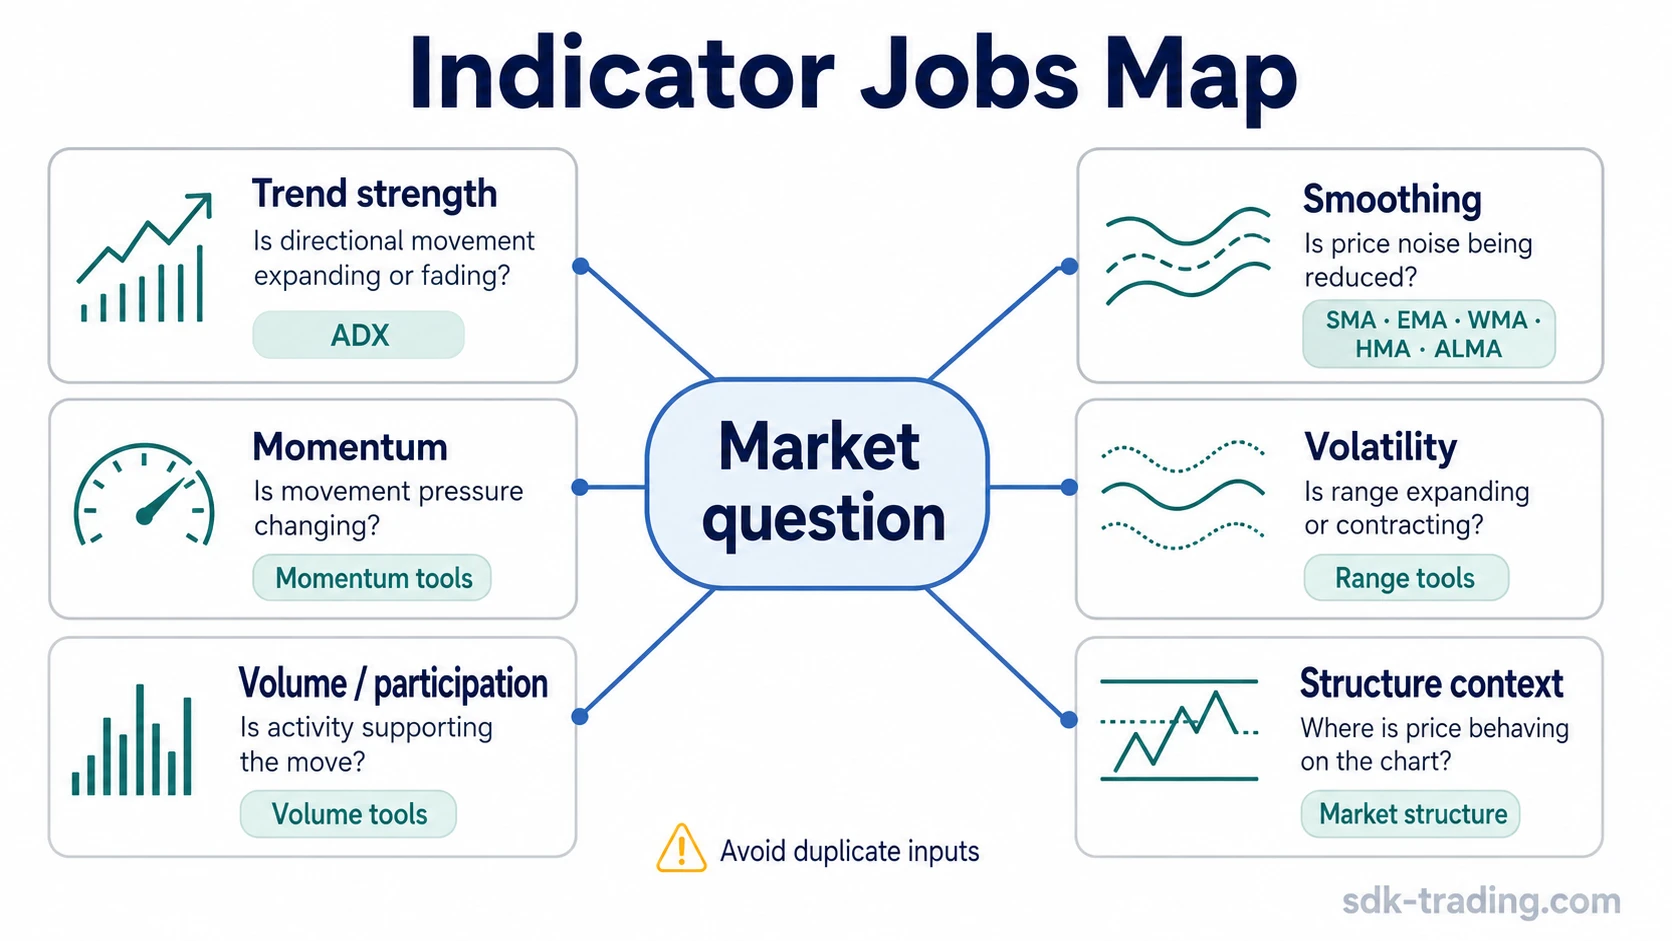
The best trading indicators depend on the market condition being measured. A trend-strength tool, a smoothing tool, a momentum oscillator, a volatility measure, and a volume-based reading do different jobs, so a useful selection starts with the market question rather than a fixed ranking.
Trading indicators are chart-based calculations or visual tools that organize price, volume, volatility, momentum, or trend behavior into a more readable form. They can help structure analysis, but they do not make a market outcome certain and should not be treated as a universal decision system.
Definition: A trading indicator is a technical-analysis tool that transforms market data into a visual or numerical reading, such as trend direction, trend strength, smoothing, momentum, volatility, or participation.
A stronger selection separates different inputs instead of stacking tools that repeat the same price, momentum, or smoothing information.
Key Points
- Best does not mean universal; it means fit for the market condition being measured.
- Indicator groups measure different jobs, including trend, smoothing, momentum, volatility, volume, and structure.
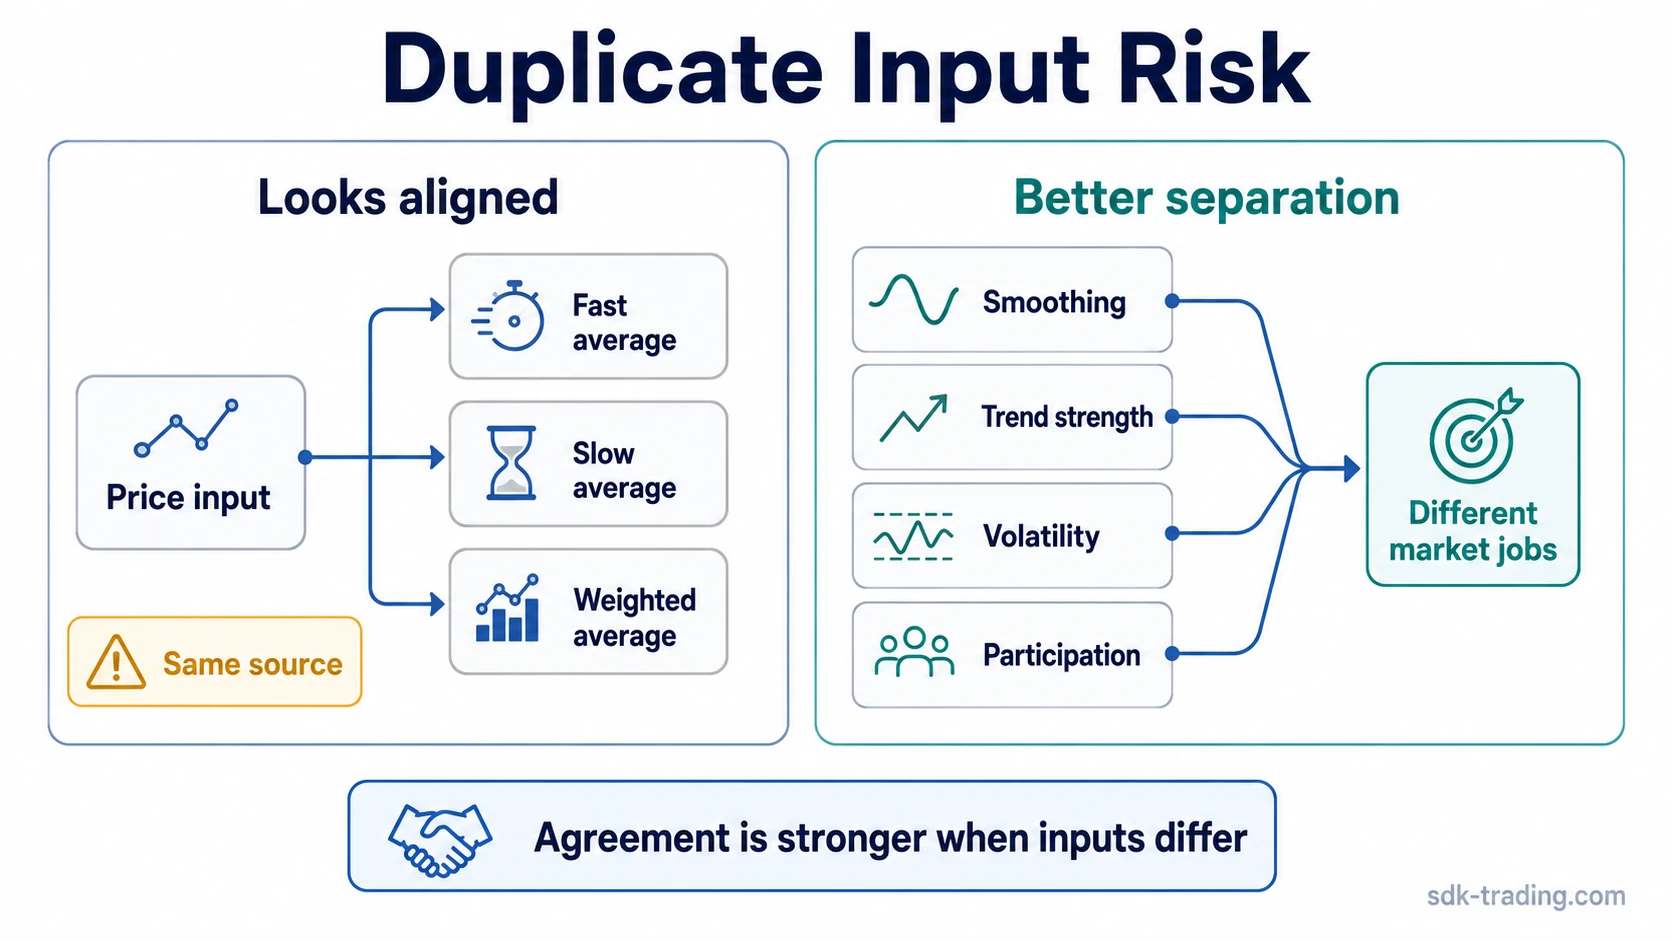
- Several indicators can appear to agree simply because they use the same underlying input.
- Trend and smoothing tools should be selected by measurement job, not by popularity alone.
- Individual indicator mechanics are clearer when the specific tool is studied on its own rather than forced into a broad ranking.
What “Best” Means for a Trading Indicator
A useful indicator answers a defined market question. If the question is whether a move has directional strength, a trend-strength indicator is more relevant than a volatility band. If the question is whether price noise should be smoothed, a moving average can be more relevant than a momentum oscillator.
The main filter is measurement job. Trend tools help assess direction or directional strength. Smoothing tools reduce noise in price movement. Momentum tools compare current movement with prior movement. Volatility tools show range expansion or contraction. Volume and participation tools add context about activity behind price movement.
The word “best” becomes misleading when it turns into a fixed ranking. A fast indicator can respond quickly but produce more noise. A slower indicator can reduce noise but react late. A volume tool can add participation context, but it does not replace price structure. The stronger question is not which indicator is best overall, but which input is missing from the current analysis.
Best Trading Indicators Quality Filter
A quality filter keeps indicator selection tied to a specific job. It also prevents a broad indicator list from becoming a pile of similar tools that all repeat the same message.
| Indicator group | What it measures | When it helps | Common misread | Focused indicator |
|---|---|---|---|---|
| Trend strength | Whether directional movement is expanding or fading | When price is trending but direction alone is not enough | Treating strength as timing rather than context | ADX trend strength |
| Baseline smoothing | Average price behavior over a selected lookback | When the goal is to reduce noise and define a broad trend baseline | Reading a slow average as if it responds instantly | SMA baseline smoothing |
| Faster smoothing | Price smoothing with more weight on recent data | When a trader wants a moving average that responds faster than a simple average | Confusing speed with better reliability | EMA faster moving-average smoothing |
| Weighted smoothing | Recent-price emphasis inside a smoothing calculation | When recent price behavior should carry more influence than older bars | Assuming recent weighting removes lag completely | WMA weighted smoothing |
| Low-lag smoothing | Smoothing designed to reduce lag while still filtering noise | When a smoother trend read is needed without the full delay of slower averages | Treating reduced lag as prediction | HMA low-lag smoothing |
| Adaptive smoothing | Smoother trend behavior with adaptive weighting characteristics | When the goal is a cleaner trend read that reacts less harshly to noise | Assuming smoother output means stronger evidence | ALMA adaptive smoothing |
| Momentum | Speed or pressure behind price movement | When price direction needs a pressure check | Reading an extreme momentum value without structure | Category context; specific momentum tools need their own mechanics. |
| Volatility | Range expansion, contraction, or changing movement size | When the market is shifting between quiet and expanded movement | Treating volatility expansion as direction by itself | Category context; specific volatility tools need their own mechanics. |
| Volume and participation | Activity behind price movement | When price movement needs confirmation from participation | Reading high activity as automatically bullish or bearish | Category context; specific volume tools need their own mechanics. |
Trend and Smoothing Indicators
Trend and smoothing tools are often grouped together, but they do not answer the same question. Trend-strength tools help assess whether directional movement is expanding or weakening. Moving averages smooth price so the underlying direction is easier to read.
ADX belongs in the trend-strength group because it focuses on directional strength rather than smoothing price into a visible average. Moving averages belong in the smoothing group because they reshape price data into a cleaner line. The difference matters because a market can be above a moving average while directional strength is still weakening.
Simple, exponential, weighted, low-lag, and adaptive moving averages all smooth price differently. A slower average can help define a broad baseline. A faster or weighted average can respond more quickly. A low-lag or adaptive smoother can reduce some delay, but it still remains a derived reading of price behavior rather than a forward-looking tool.
Momentum, Volatility, and Volume Indicators
Momentum indicators focus on the pace or pressure of price movement. They are most useful when the reading is compared with structure, trend behavior, and the condition that created the move. They can also stay extreme during strong trends, so the surrounding structure matters.
Volatility indicators focus on range behavior. They separate quiet compression from expanded movement, but they do not identify direction on their own. Rising volatility can appear during strong continuation, failed breaks, or disorderly movement.
Volume and participation tools add activity context behind price movement. High activity needs price-result interpretation before it becomes meaningful. A large volume reading with little progress can mean something different from large volume with strong acceptance in the direction of the move.
Leading vs Lagging and Fast vs Slow Indicators
Leading and lagging are often used too loosely. Most technical indicators are derived from past or current market data, so even a fast indicator is not a prediction engine. The useful distinction is whether the tool responds early enough to capture a change, or slowly enough to filter noise.
Fast indicators can react sooner, but they may also react to noise. Slow indicators can reduce false movement, but they may respond after a move is already mature. The tradeoff is not a flaw by itself. It is a design choice that should match the market job: early sensitivity, cleaner smoothing, trend confirmation, volatility awareness, or participation context.
Limitation: A faster indicator does not automatically create a better reading, and a slower indicator does not automatically create a safer reading. The value depends on whether the tool adds a missing input or only repeats what price already shows.
Why More Indicators Can Create False Confidence
Adding more indicators can make a chart look more complete while adding little independent information. Three moving averages may appear to confirm one another, but they may all be smoothing the same price input. Several momentum tools can also agree because they are all reacting to the same recent price movement.
Price can rise above several moving averages at the same time after a strong advance. That agreement may look convincing, but the readings are not independent if every tool is mainly responding to the same price expansion. A stronger indicator mix separates different inputs, such as trend strength, smoothing, momentum, volatility, and participation.
Common mistake: Treating indicator agreement as stronger evidence without checking whether the indicators measure different conditions. Duplicate inputs can create confidence without adding a new market read.
Best Indicators for Day Trading vs Swing Trading
Day trading usually places more pressure on speed, noise control, and execution context because price changes happen inside shorter observation windows. Fast smoothing, momentum, volatility, and participation tools can be useful in that environment, but faster readings can also create more noise.
Swing trading usually allows more room for broader trend structure, moving-average context, volatility contraction or expansion, and multi-session participation. A slower tool may be more acceptable when the goal is to understand the broader move rather than every short-term fluctuation.
The distinction is not that one indicator group belongs only to one timeframe. The distinction is tolerance for noise, lag, and the type of market condition being measured.
Simple Indicator Selection Example
Price advances for several sessions and moves above a group of moving averages. A fast average, a slow average, and a weighted average all point higher, but they are still variations of price smoothing. The chart may look aligned, yet the information is mostly coming from the same source.
A cleaner read separates the inputs. One tool can define the smoothing baseline, another can check whether directional strength is expanding or fading, and a separate participation or volatility measure can show whether the move has broader support or is only moving through a quiet range. The scenario remains incomplete if every tool repeats the same input in a different format.
FAQ
What are the best trading indicators overall?
The best trading indicators are the ones that match the market condition being measured. Trend strength, smoothing, momentum, volatility, and volume tools answer different questions, so no single indicator is universally best.
How many indicators should a trader use?
A smaller set is usually clearer when each tool measures a different input. Too many indicators can create false confidence if several of them repeat the same price, momentum, or smoothing information.
Are moving averages enough for indicator analysis?
Moving averages can help smooth price and define trend context, but they mainly process price data. They do not replace trend-strength, volatility, volume, or market-structure context when those inputs are relevant.
Do day traders and swing traders need different indicators?
They may use some of the same indicator families, but the weighting changes. Day trading usually demands more sensitivity and noise control, while swing trading can give more weight to broader trend and multi-session context.