The SMA indicator is a simple moving average used in technical analysis to smooth price by averaging the same number of recent values. Each value inside the selected period receives equal weight, so the line reacts more slowly than averages that emphasize recent price.
An SMA can help organize price behavior around a baseline, but it does not confirm trend direction by itself. The line is built from past prices, so every reading still needs price context, slope, structure, and follow-through before the interpretation becomes useful.
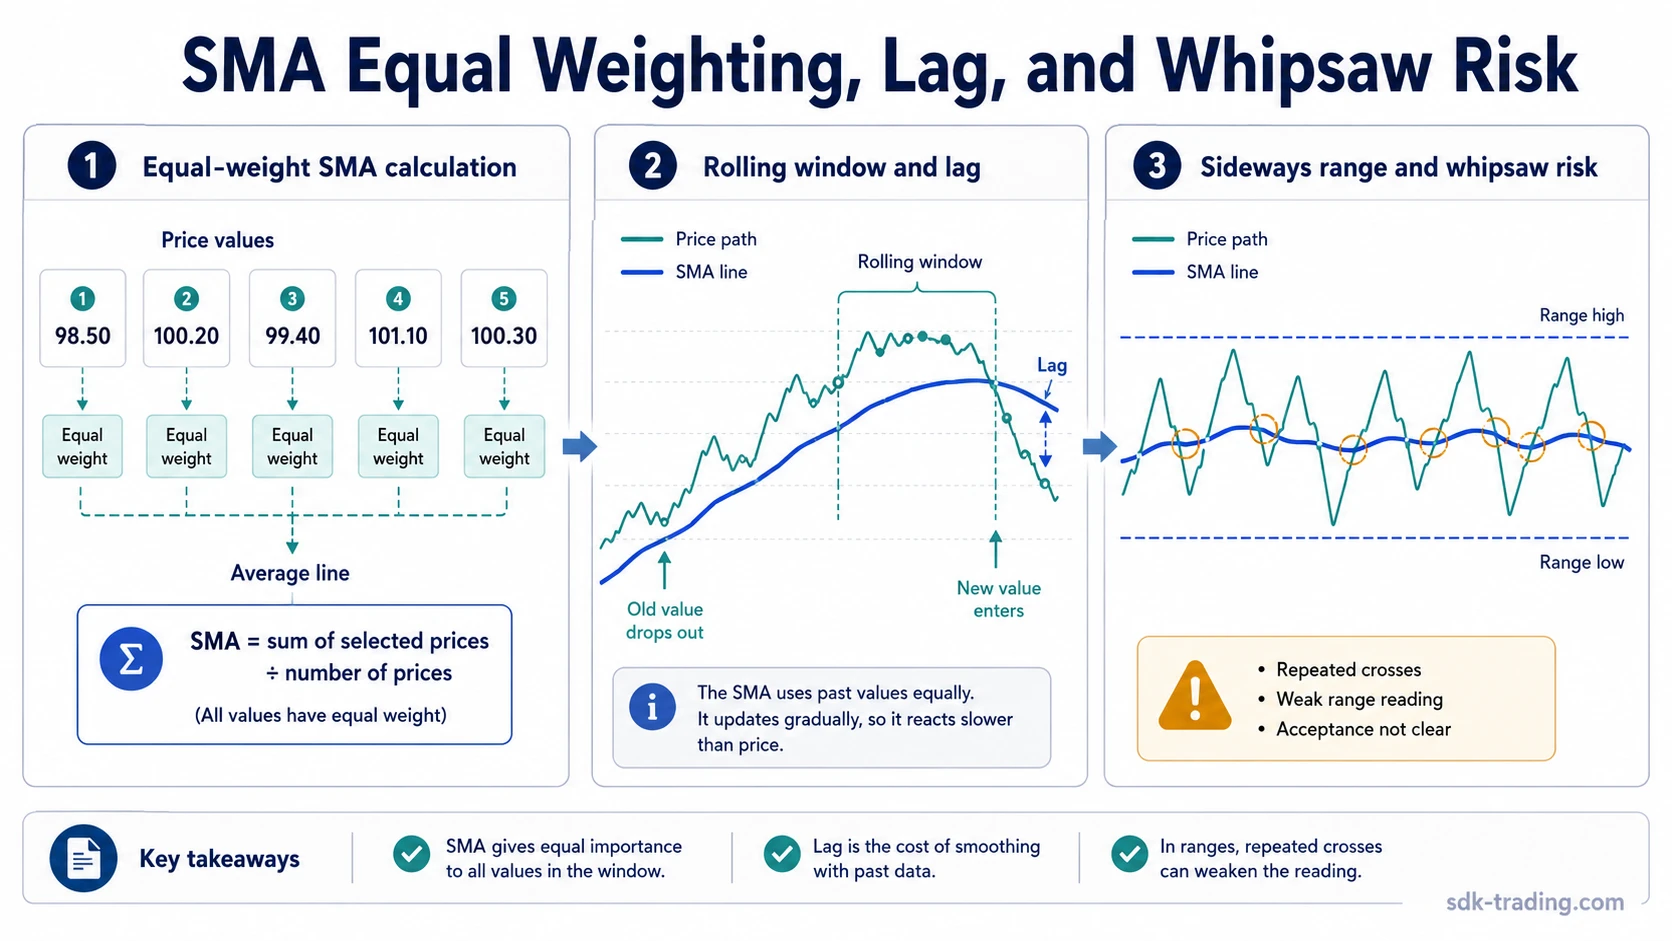
Definition: An SMA, or simple moving average, is an equal-weight moving average that adds the selected number of price values and divides the total by the number of values in the period.
Key Points
- The SMA indicator smooths price by using an arithmetic average over a selected period.
- Every price value inside the SMA period receives the same weight.
- Equal weighting creates lag because older values still affect the line until they leave the rolling window.
- Shorter SMAs react faster and usually produce more noise, while longer SMAs smooth more and react later.
- A price cross above or below an SMA is only a relationship change, not full confirmation of trend quality.
What Is the SMA Indicator?
The SMA indicator is a trend-following moving average that turns a series of price values into one smoothed line. Traders often use it to compare current price with an average level from a recent lookback period.
The central feature is equal weighting. A 20-period SMA gives the first value in the window and the twentieth value in the window the same influence. That makes the SMA easy to interpret, but it also explains why the line may react slowly when price changes direction quickly.
What the SMA is: an equal-weight smoothing baseline built from historical price values.
What the SMA is not: a prediction tool, a complete trend model, or a standalone confirmation that price will continue in one direction.
How the Simple Moving Average Is Calculated
The SMA calculation adds the selected price values and divides the total by the number of values in the period. A 10-period SMA on closing prices adds the last 10 closes and divides the result by 10.
SMA = sum of selected price values / number of selected values.
The calculation updates through a rolling window. When a new price value enters the average, the oldest value drops out. That rolling behavior is why the SMA line changes from one candle or bar to the next even when the selected period stays the same.
Simple calculation example: If the last five closes are 98, 100, 101, 103, and 108, the 5-period SMA is 102. The newest close affects the line, but the earlier four closes still matter equally inside the same window.
Why Equal Weighting Creates SMA Lag
Lag appears because the SMA is an average of past values. The line cannot move as quickly as the latest price because older prices remain inside the calculation until the rolling window replaces them.
This lag is not a calculation error. It is the tradeoff created by smoothing. A smoother line can make broad direction easier to see, but the same smoothing can delay recognition when price turns sharply or moves sideways with repeated reversals.
The difference becomes clearer when comparing SMA with averages that emphasize recent price. A detailed SMA vs EMA comparison separates equal weighting from recent-price weighting without turning the SMA reading into a crossover rule.
How Traders Read Price Against an SMA
Price above an SMA can suggest that current price is trading above its recent average. Price below an SMA can suggest that current price is trading below its recent average. The interpretation gains quality only when the slope of the line and the surrounding price structure support the same reading.
A rising SMA with price holding above it gives a cleaner trend-context reading than a flat SMA with price crossing back and forth through it. A falling SMA with price failing to reclaim the line can show weaker upside behavior, but that still describes context rather than a complete decision rule.
The most important distinction is acceptance. A brief move above or below the line can be noise. Price has to hold one side of the average long enough for the relationship to show structure, not just a single cross.
Clean, Weak, and Invalid SMA Readings
SMA readings become more useful when they are classified by quality rather than treated as automatic signals. The same price cross can mean different things depending on slope, follow-through, and whether price accepts one side of the average.
| Reading Type | Typical Behavior | Interpretation Boundary |
|---|---|---|
| Clean SMA reading | Price holds mostly on one side of the average while the SMA slope supports the same direction. | The line provides useful trend context, but still needs surrounding structure. |
| Weak SMA reading | Price repeatedly crosses the SMA while the line flattens or turns unevenly. | The average is likely describing noise rather than clear directional quality. |
| Invalid SMA reading | Price briefly clears the average but quickly rejects the move and fails to hold the tested side. | The original interpretation loses quality because acceptance did not appear. |
This classification keeps the SMA tied to market behavior. The line is strongest as a context filter when price, slope, and acceptance point in the same direction. It is weakest when the chart is range-bound and the average keeps changing direction inside the range.
Whipsaw example: A short SMA may turn up and down several times while price stays inside the same range. The weak reading is not each individual cross. The weak reading is that price has not accepted one side of the average long enough for the line to provide clean trend context.
SMA Period Selection and Whipsaw Risk
The selected period changes the character of the SMA. A short period reacts faster because fewer values are averaged. A long period reacts slower because more values must be replaced before the line changes meaningfully.
| SMA Period Choice | Line Behavior | Main Risk |
|---|---|---|
| Shorter SMA | More responsive to recent price changes. | More vulnerable to repeated crosses and noisy readings. |
| Medium SMA | Balances responsiveness and smoothing. | Can still lag turning points and lose clarity in ranges. |
| Longer SMA | Smoother and slower to react. | May delay recognition when market behavior changes quickly. |
Common mistake: Treating a shorter SMA as automatically better because it reacts faster. Faster response can also mean more false movement around the line, especially when price is moving sideways.
Whipsaw risk appears when price crosses above and below an SMA several times without follow-through. In that environment, the line may still be calculated correctly, but the reading quality is weak because price is not accepting either side of the average.
A flat SMA inside a range can be mechanically correct but analytically low-value because price is not holding either side of the average.
SMA vs EMA and Nearby Trend Indicators
SMA and EMA both smooth price, but they do not weight the data the same way. The SMA treats each included value equally, while the EMA gives more influence to recent price. That weighting difference changes responsiveness, lag, and how quickly the line turns after new price behavior appears.
Nearby trend indicators can also use different logic. Parabolic SAR plots a trailing-style trend reference rather than an equal-weight average.
Supertrend combines trend direction with volatility-based placement. Those indicators should not be read as interchangeable versions of the SMA because their construction and failure modes differ.
The SMA remains most useful when the analysis needs a simple equal-weight baseline. Other trend indicators may react differently, but a faster or more complex line does not automatically create a stronger reading.
Limitations of the SMA Indicator
The SMA is built from historical prices, so it always describes past data. It can clarify the relationship between current price and a recent average, but it cannot remove uncertainty from future price movement.
The main limitation is lag. Equal weighting makes the line slower to respond than a recent-weighted average, and that delay can matter when price changes direction quickly. A long SMA may remain smooth while the market has already started to change behavior.
Another limitation is parameter sensitivity. A 20-period SMA and a 200-period SMA can give very different impressions on the same chart. Neither period is universally superior. The useful period depends on the market, timeframe, volatility, and the kind of context the trader is trying to organize.
Reading boundary: The SMA can support trend context, but the interpretation weakens when price repeatedly crosses the line, the slope is flat, or surrounding structure fails to confirm acceptance on one side of the average.
FAQ
What does the SMA indicator measure?
The SMA indicator measures the arithmetic average of selected price values over a chosen period. It smooths price into a single line so current price can be compared with its recent average.
Why does the SMA lag behind price?
The SMA lags because it averages past values. Older prices stay inside the calculation until the rolling window replaces them, so the line reacts more slowly than current price.
Is a price cross above or below the SMA enough to confirm trend direction?
A price cross is not enough by itself. The reading needs slope, price structure, acceptance, and follow-through before it becomes a stronger trend-context interpretation.