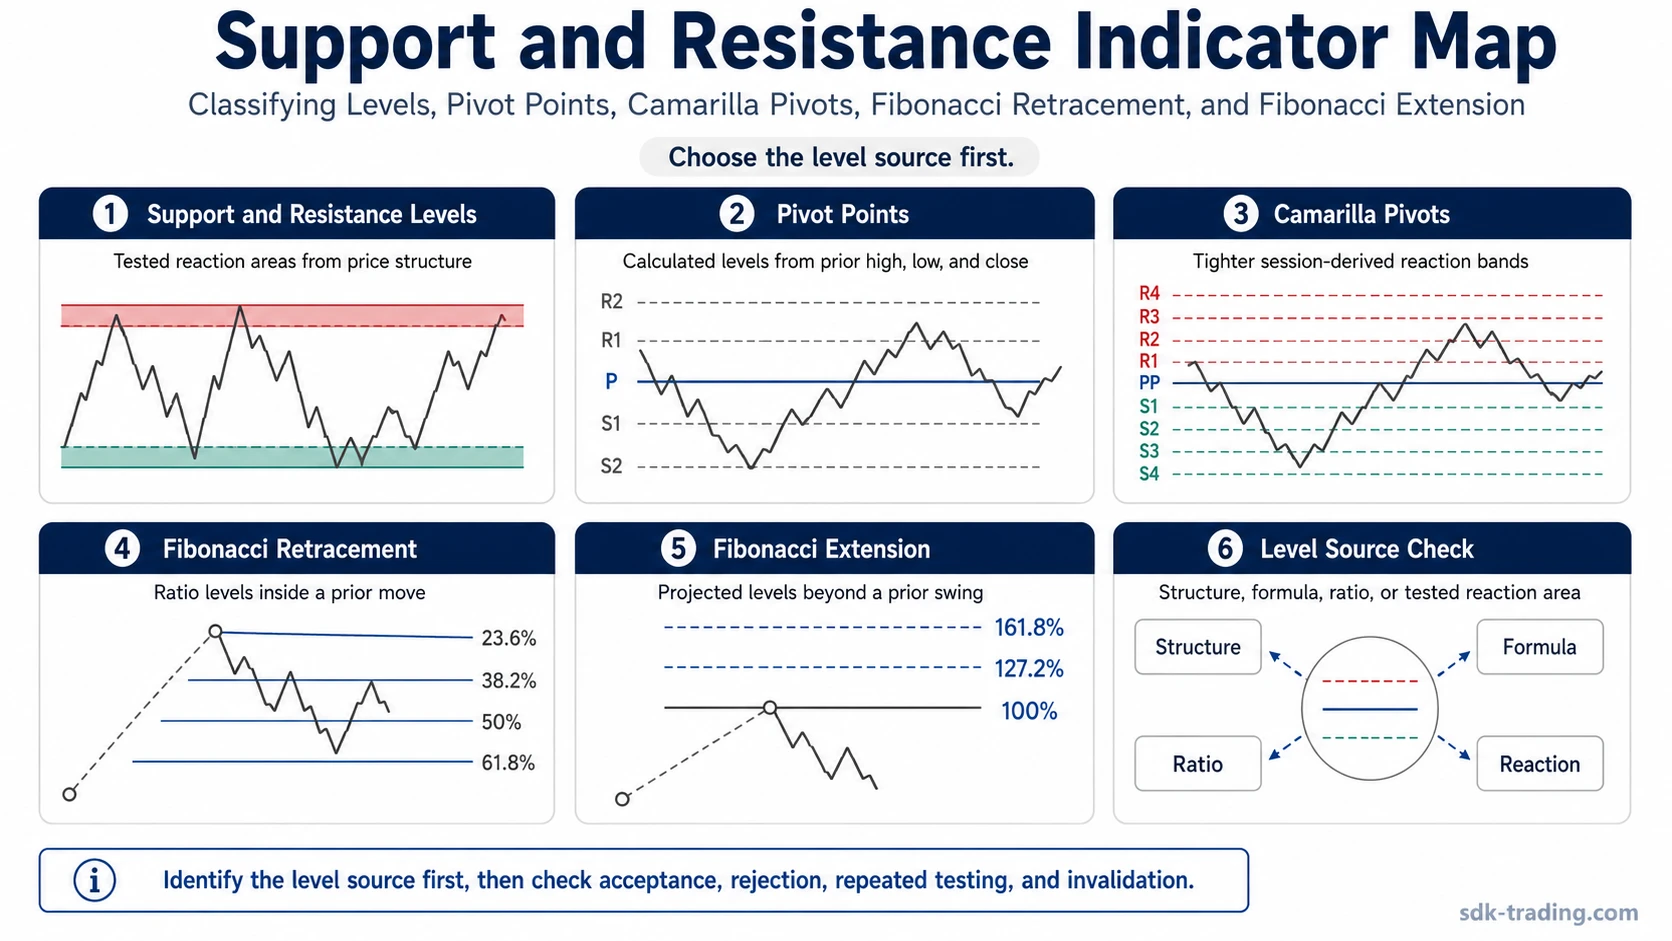
Support and resistance indicators classify where price has reacted, where formula-based levels are drawn, and where traders may watch future tests. The useful distinction is the level source: price structure, pivot calculation, Fibonacci ratio, or repeated reaction area.
Definition: Support and resistance indicators are technical-analysis tools that organize potential reaction areas on a chart. Some tools mark observed levels from prior price behavior, some calculate pivot levels from prior high, low, and close data, and others project Fibonacci relationships from a measured swing.
A level is not the same thing as a signal. A horizontal support zone, a pivot level, a Camarilla band, and a Fibonacci retracement can all appear near price, but they come from different sources and should not be read as identical evidence.
Key Points
- Support and resistance indicators should be classified by level source before interpreting the reaction.
- Observed levels, pivot calculations, Camarilla pivots, Fibonacci retracements, and Fibonacci extensions do not describe the same type of evidence.
- A tested area becomes more useful when price acceptance, rejection, repeated testing, and invalidation are visible.
- Weak readings often come from treating every line on a chart as if it carries the same meaning.
Support and Resistance Indicator Classification
The fastest way to classify a support or resistance indicator is to ask where the level comes from. A manually observed level comes from price behavior. A pivot point comes from a formula. A Fibonacci retracement comes from ratios inside a prior move. A Fibonacci extension projects levels beyond a measured swing.
| Reader question | Best route | Level source boundary |
|---|---|---|
| Where has price reacted before? | Support and Resistance Levels | Use for horizontal levels, zones, and tested reaction areas from prior price structure. |
| Where are formula-based intraday or session levels drawn? | Pivot Points | Use when levels are calculated from prior high, low, and close data. |
| Which pivot method creates tighter reaction bands? | Camarilla Pivots | Use when the question is about Camarilla-style calculated bands rather than standard pivots. |
| Where are ratio levels inside a prior swing? | Fibonacci Retracement | Use for ratio levels that sit inside a measured move. |
| Where are projected levels beyond a prior swing? | Fibonacci Extension | Use for projected ratio levels beyond the measured move, not as guaranteed targets. |
| How should automated support-resistance tools be interpreted? | Support and Resistance Indicator | Use when the question is about a general support-resistance tool rather than a specific level source. |
| How do Fibonacci retracement and extension differ? | Fibonacci Retracement vs Extension | Use when the question is about inside-move ratio levels versus projected levels beyond the move. |
Level Source Before Reaction
A support or resistance reading starts with the level source. Price-structure levels depend on observed reactions. Pivot levels depend on a calculation. Fibonacci levels depend on how the swing is measured. Automated support-resistance tools may combine several methods, so the underlying source still needs to be checked.
The reaction around the level is a separate step. A level may be tested, accepted, rejected, broken, retested, or ignored. The line itself does not prove which response will happen. The reading becomes cleaner only after the level source and the actual price behavior are kept separate.
Classification check: Identify whether the level comes from price structure, pivot calculation, Fibonacci ratio, or repeated reaction behavior. Then check acceptance, rejection, repeated testing, and invalidation.
Why Support and Resistance Tools Can Disagree
Support and resistance tools can disagree because they are not measuring the same thing. A prior swing low may create a visible support zone, while a pivot formula may draw a nearby calculated level. A Fibonacci retracement may sit in the same area for a different reason. That overlap can be useful, but it does not make the tools identical.
The reading is weaker when nearby lines are treated as automatic confirmation. Several levels can cluster because they are derived from similar price inputs or from the same visible swing. A stronger reading asks whether price actually responds around that area and whether the response changes the market structure.
Pivot, Fibonacci, and Price-Structure Boundaries
| Tool family | What creates the level | Common misread |
|---|---|---|
| Price-structure levels | Repeated reaction around visible highs, lows, zones, or consolidation areas. | Assuming every old high or low remains important without a fresh test. |
| Pivot points | Formula-based levels from prior high, low, and close data. | Reading calculated levels as if they were observed demand or supply zones. |
| Camarilla pivots | A tighter pivot framework built from prior session data. | Using every band as a separate signal instead of a reaction reference. |
| Fibonacci retracement | Ratio levels inside a measured prior move. | Treating a retracement level as confirmation before price reacts there. |
| Fibonacci extension | Projected ratio levels beyond a measured move. | Treating projected levels as guaranteed targets. |
How to Read Support and Resistance Indicators
Start with the source of the level, then check what price does around it. A level that is tested several times without acceptance carries a different message from a level that price crosses cleanly and then holds on a retest.
Context also matters. A level inside a noisy range is not the same as a level at the edge of a larger structure. A pivot cluster near a prior reaction zone may deserve attention, but the interpretation still depends on price behavior, volume context where relevant, and whether the level continues to organize later responses.
When Support and Resistance Readings Need Caution
Support and resistance readings become weaker when too many lines are placed on the same chart without a clear reason for each one. A chart can look precise while the actual evidence is mixed, duplicated, or derived from the same swing several times.
The safer approach is to classify the level source first, then decide whether the level is being accepted, rejected, retested, or invalidated. That keeps support and resistance indicators from becoming a collection of disconnected lines with no hierarchy.