Pivot points are calculated trading levels based on the prior period’s high, low, and close. The calculation creates a fixed reference grid for the next session or selected period, with a central pivot and surrounding support and resistance tiers. A level touch is only a reference event unless price behavior around the level supports the reading.
Definition: Pivot points are technical-analysis levels that convert the previous period’s range and close into a central pivot level, resistance levels above it, and support levels below it.
Key Points
- Pivot points use prior high, low, and close as the main calculation inputs.
- The central pivot anchors the next-period reference grid.
- Support and resistance tiers remain fixed until the selected recalculation boundary.
- A level touch is weak by itself unless price reacts, rejects, accepts, or rotates around the area.
- Session choice, data feed, extended-hours treatment, and settlement conventions can change plotted levels.
What Are Pivot Points?
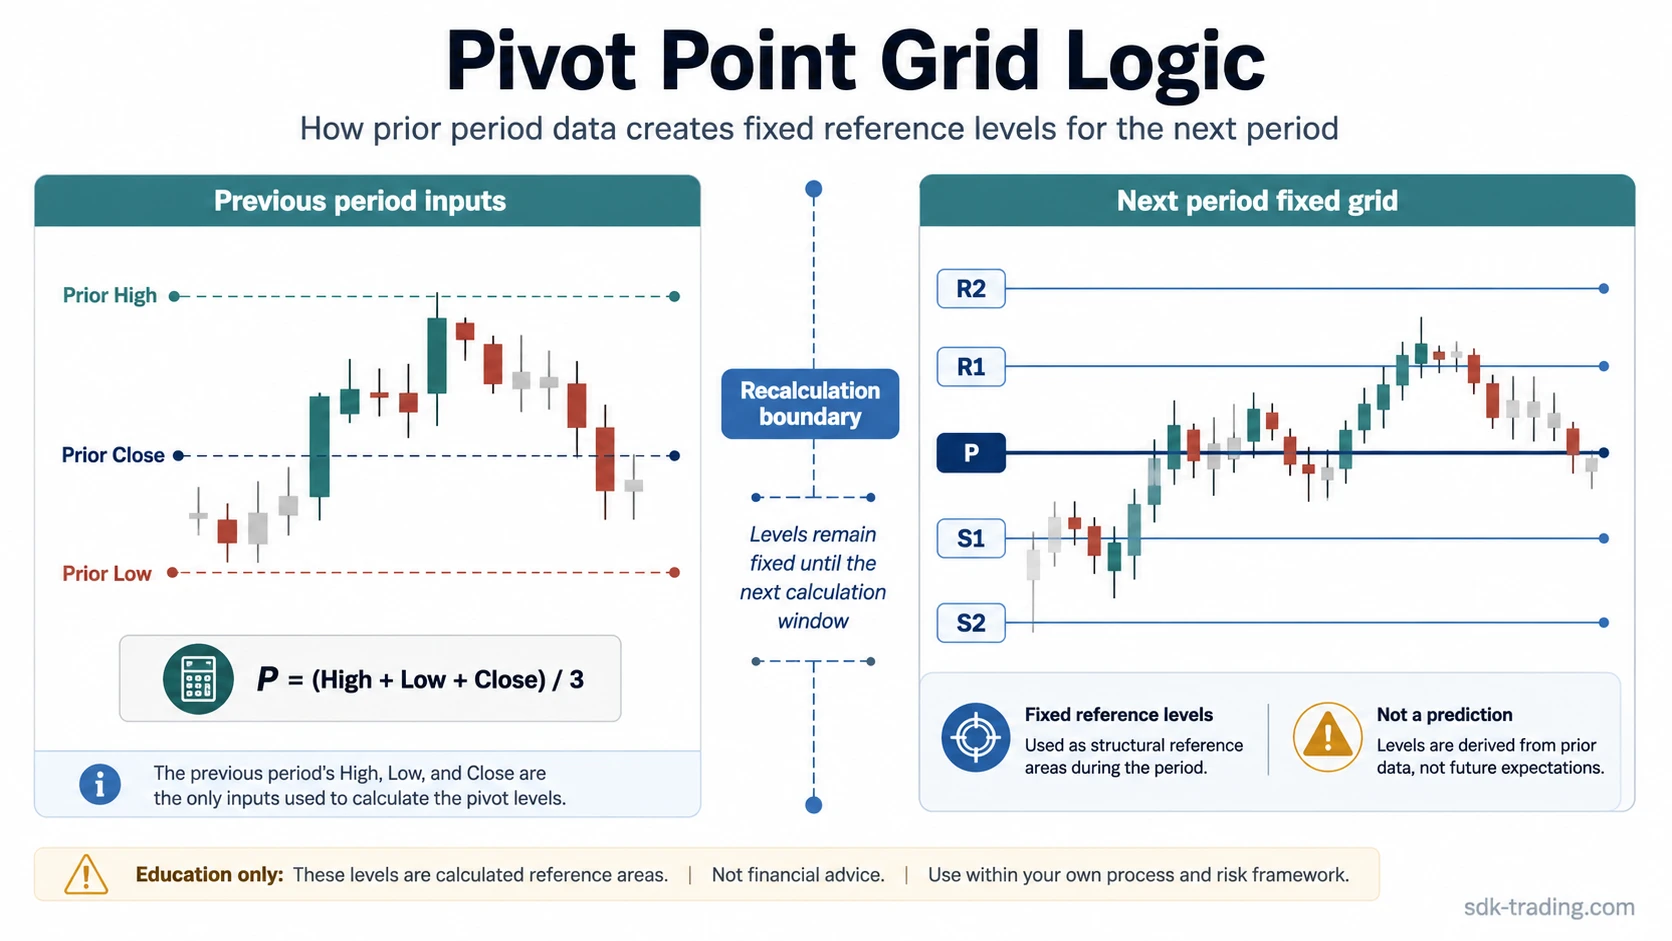
Pivot points are a calculated support and resistance framework. Instead of drawing levels from repeated visual reactions on a chart, the method starts with the previous period’s high, low, and close, then projects a central pivot and tiered levels for the next period.
The central pivot, usually labeled P, acts as the axis of the grid. Resistance levels such as R1 and R2 sit above the pivot. Support levels such as S1 and S2 sit below it. The grid does not prove that price will reverse at a level or continue through it. It gives a fixed structure for observing whether price accepts, rejects, ignores, or rotates around calculated areas.
The main boundary is mechanical. A pivot level can look precise because the formula is precise, but market response still has to be read from price behavior. A mathematically clean level can still fail if volume, direction, volatility, or session structure overwhelms the grid.
How Pivot Points Are Calculated
The standard pivot point formula starts with three values from the prior period: high, low, and close. The period can be daily, weekly, monthly, or another selected calculation window, depending on the chart and data settings.
| Level | Standard formula | Role in the grid |
|---|---|---|
| P | (High + Low + Close) / 3 | Central pivot level |
| R1 | (2 x P) – Low | First resistance tier |
| S1 | (2 x P) – High | First support tier |
| R2 | P + (High – Low) | Second resistance tier |
| S2 | P – (High – Low) | Second support tier |
| R3 | High + 2 x (P – Low) | Third resistance tier, used when plotted |
| S3 | Low – 2 x (High – P) | Third support tier, used when plotted |
Some charting platforms label pivot variants differently, so the formula set should be checked before comparing levels across tools.
Standard/traditional, Fibonacci, Woodie, DeMark, and Camarilla pivot variants can use different formulas, constants, or weighting choices. The common idea remains the same: prior-period data is transformed into a calculated level grid. The calculation type should not be mixed casually, because each version can plot different levels.
How the Pivot Point Grid Works
After the levels are calculated, they normally stay fixed until the next recalculation boundary. A daily pivot grid, for example, is commonly based on the previous daily high, low, and close, then used as a fixed reference during the next trading day. Weekly or monthly pivots change less frequently because the source period is longer.
The central pivot is often read as the balance point of the prior period. Price holding above it can show that the market is accepting higher areas relative to the prior range. Price failing below it can show that the prior balance is not holding. Those readings remain conditional because a single move through P, R1, or S1 can be a test, a false break, or temporary volatility rather than a stable change in control.
Pivot points differ from observed support and resistance levels because pivot levels come from a formula, while observed levels come from prior reactions, congestion, failed breaks, and repeated market behavior around a price area.
Reading Quality Around Pivot Levels
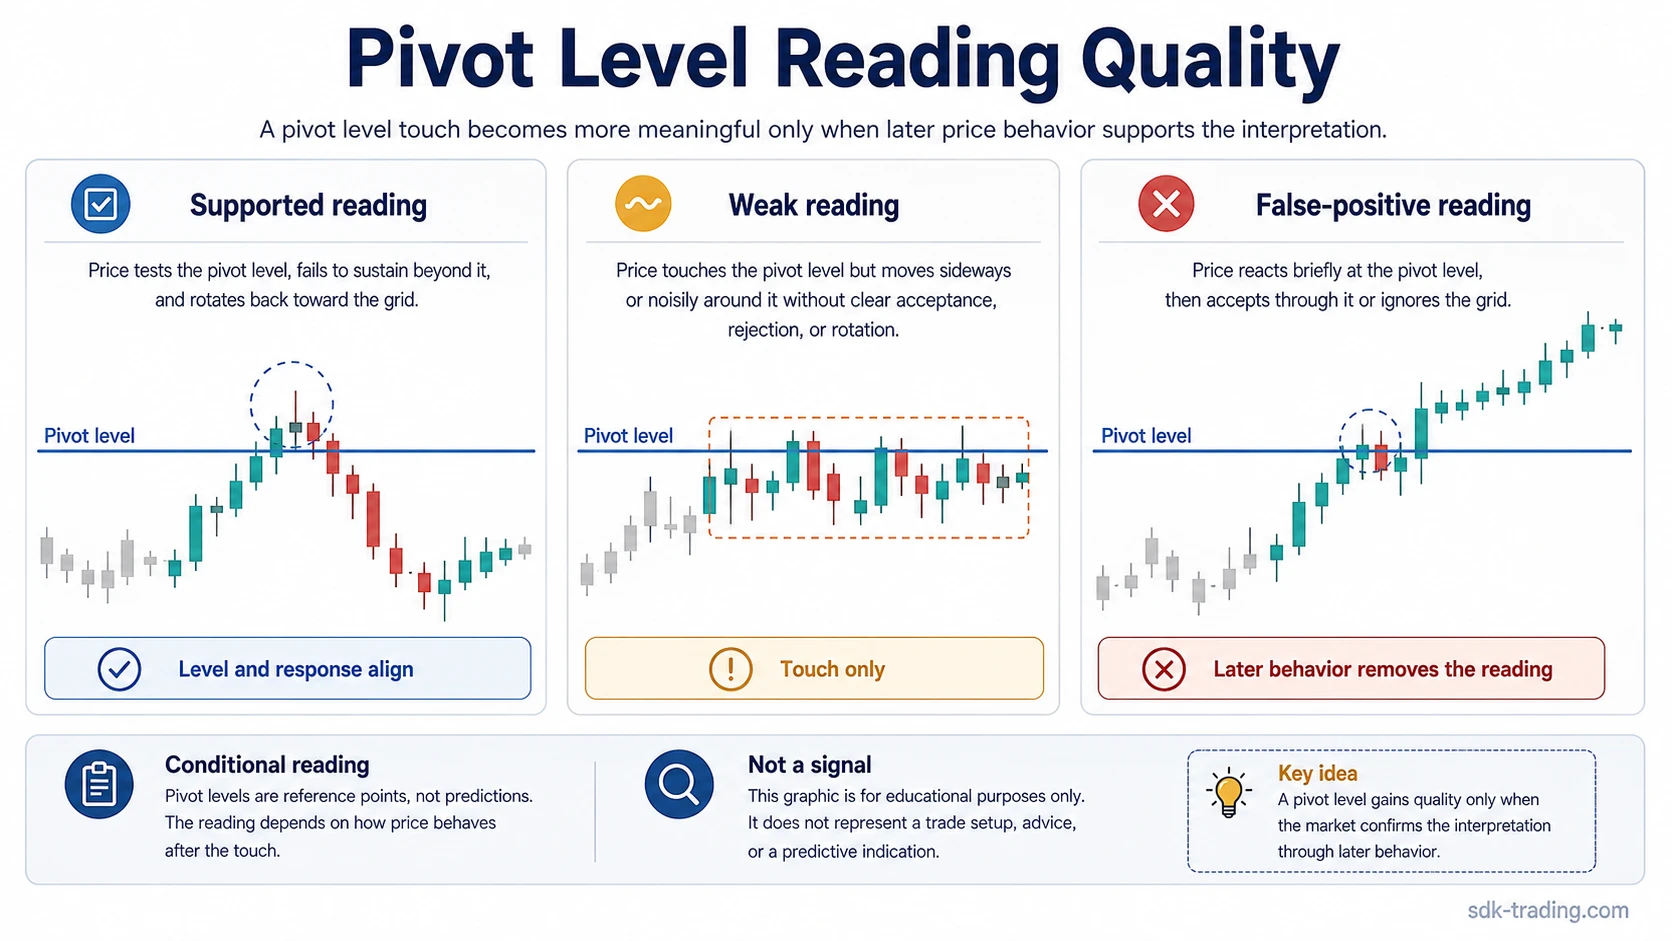
A pivot point reading improves when the calculated level and the market’s behavior around that level point in the same direction. The level creates the location; price behavior supplies the evidence. Without that second part, the grid can become a set of neat lines that price simply moves through.
| Reading type | What appears around the level | Why the reading changes |
|---|---|---|
| Supported reading | Price tests a pivot tier, fails to sustain beyond it, then rotates back toward the grid. | The level and the later price response point to the same area of interest. |
| Weak reading | Price touches R1, S1, or P, but movement around the level is noisy and unresolved. | The level is visible, but the market has not shown rejection, acceptance, or a stable rotation. |
| False-positive reading | Price reacts briefly at a level, then quickly accepts through it or ignores the grid. | The first touch looked meaningful, but later behavior removed the level’s interpretive value. |
Simple pivot point example: A market opens above the central pivot, moves into R1, hesitates, then falls back through the pivot and continues to rotate inside the grid. The first R1 touch was not enough to support a strong reading. The reading depends on whether price accepted above R1, rejected it clearly, or treated the level as a temporary pause inside a wider rotation.
Why Pivot Points Can Fail
Pivot points can fail when the prior period creates a distorted grid. An unusually wide range can push R and S levels far apart, leaving the grid less useful for normal movement. An unusually narrow range can compress the levels and make ordinary volatility look more meaningful than it is.
Directional sessions can also reduce the value of static levels. If price accepts through several tiers with little rotation, the grid may describe where price has been, but not where control is changing. In that condition, the mistake is treating every crossed level as a separate event instead of recognizing that the session is moving through a fixed structure.
Data settings can create another problem. Daily pivots may differ across platforms if one feed includes extended-hours data and another uses regular-session data. Futures, forex, and index products may also reflect different settlement or session conventions. Pivot levels are data-source sensitive and should not be assumed to be identical across every chart.
Limitation: A calculated level is not stronger just because it is mathematically exact. The grid becomes more useful when the selected session, data source, and later price behavior all support the same interpretation.
Pivot Points vs Nearby Support and Resistance Tools
Pivot points belong to the support and resistance family, but they are not the same as every other level-drawing method. Their defining feature is the prior-period calculation. The grid is known before the next selected period develops, which makes it different from levels built only from live chart reactions.
Fibonacci retracement uses a swing-selected proportional grid between a chosen high and low. Pivot points use prior-period high, low, and close to build a session-derived grid. Both can place reference levels on a chart, but the source logic is different.
| Tool | Level source | Main distinction |
|---|---|---|
| Pivot points | Prior period high, low, and close | Calculated grid for the next selected period |
| Fibonacci retracement | User-selected swing high and swing low | Proportional pullback levels inside a measured swing |
| Observed support and resistance | Repeated market reactions around price areas | Visual structure based on prior behavior rather than a formula |
| Camarilla pivots | Prior range and close with different constants | Pivot variant with closer, close-centered tiers |
Common Pivot Point Mistakes
The first common mistake is treating a pivot level as proof. A market can pause at a calculated tier simply because many traders are watching it, because volatility is slowing, or because the session is rotating. The level needs behavior around it before the reading becomes useful.
The second mistake is mixing calculation sources. A weekly pivot, a daily pivot, a regular-session pivot, and an extended-hours pivot can all describe different grids. The input period should match the interpretation being made.
The third mistake is ignoring abnormal prior ranges. A very large prior period can spread the tiers so widely that normal session behavior barely interacts with them. A very small prior period can place levels so close together that routine movement creates repeated false touches.
The fourth mistake is reading pivot points as a complete trading method. The grid only defines calculated reference areas. Price acceptance, rejection, rotation, volatility, and broader chart structure decide whether those areas carry useful information.
FAQ
What are pivot points in trading?
Pivot points are calculated technical-analysis levels based on the prior period’s high, low, and close. They create a central pivot level with support and resistance tiers around it.
How are pivot points calculated?
The standard pivot point is calculated as high plus low plus close, divided by three. Resistance and support tiers are then calculated from that central pivot and the prior period’s range.
Do pivot points update during the session?
Pivot points usually remain fixed during the selected period and update when the next calculation window begins. Daily pivots commonly update after the daily session data is complete.
Why do pivot points fail?
Pivot points can fail when price ignores the grid, accepts through a level, repeatedly whipsaws around it, or when the prior range or data source creates distorted levels.
Are pivot points the same as support and resistance?
Pivot points are a calculated type of support and resistance framework. Traditional support and resistance levels are usually drawn from observed price reactions rather than a fixed formula.