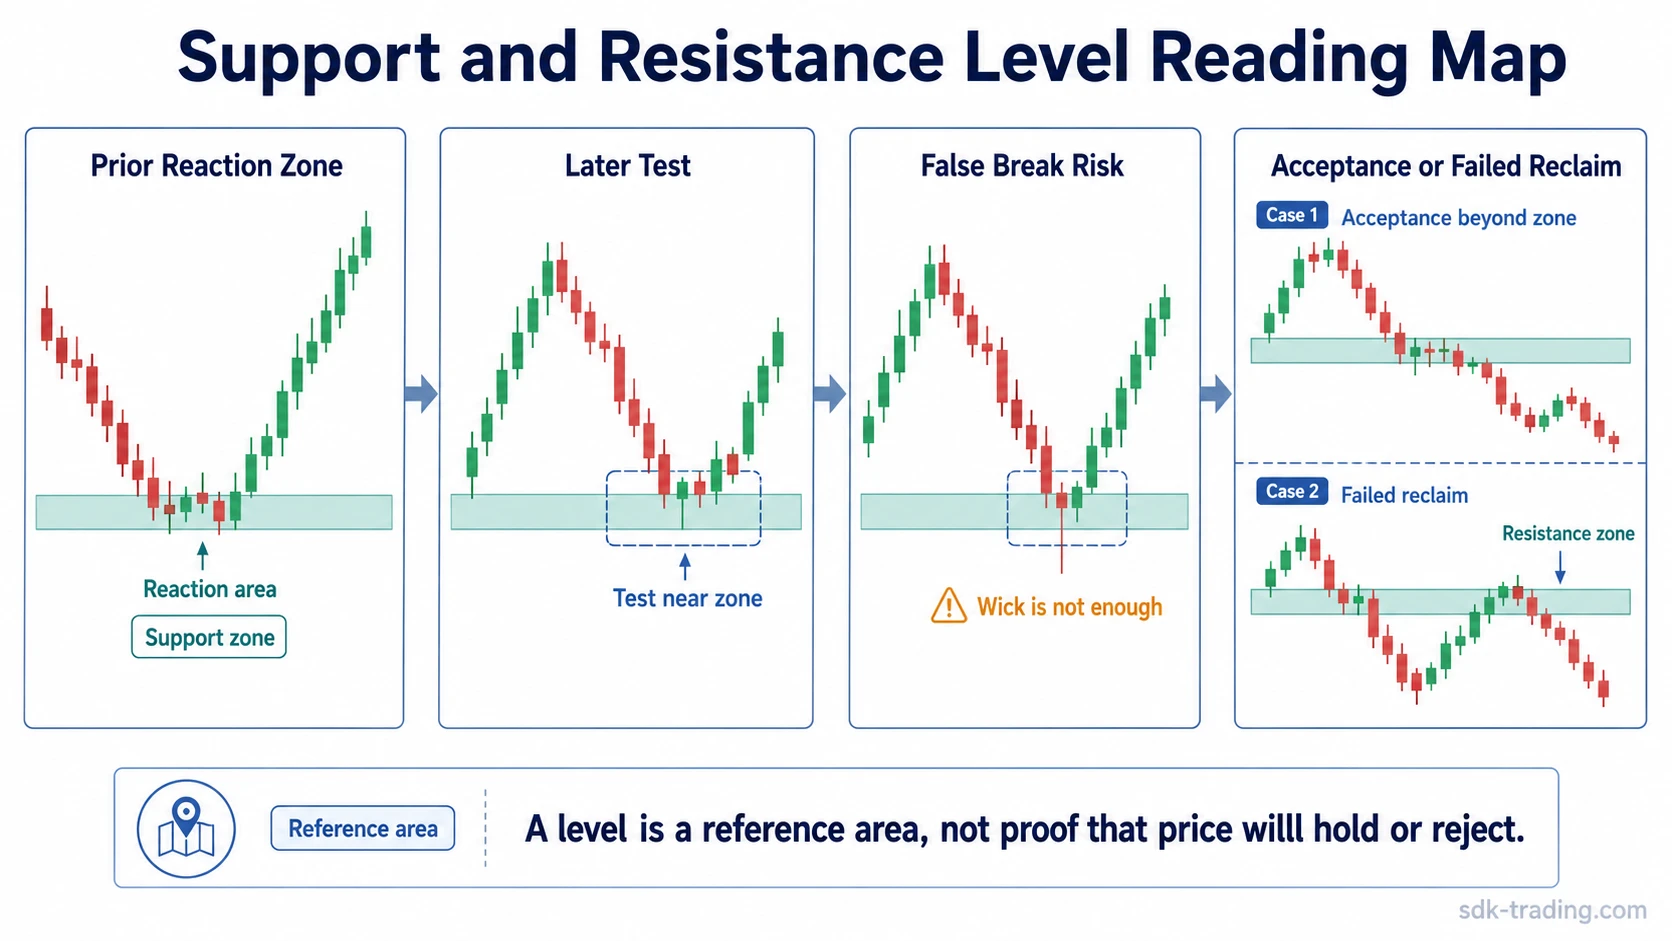
Support and resistance levels are trading reference zones created by prior price reactions. They are not exact predictive lines. A level gains practical value when price repeatedly responds near the same area and later behavior shows whether that area is still being accepted, rejected, reclaimed, or ignored.
A support level usually forms below current price where selling pressure previously slowed and buyers became more active. A resistance level usually forms above current price where buying pressure previously stalled and sellers became more active. The practical issue is not whether a line has been touched, but whether the surrounding structure still treats that area as meaningful.
Definition: Support and resistance levels are chart areas where price has previously reacted strongly enough to create a reference point for future interpretation. Support is a lower reaction area. Resistance is an upper reaction area. Both are better understood as zones, not single-price guarantees.
Key Points
- Support and resistance levels come from observed price reactions, not from a fixed formula.
- A level is usually more useful as a zone than as one exact price.
- Repeated reactions can improve level quality, but too many minor touches can also create noise.
- A break through a level is evidence to evaluate, not automatic proof that the level has failed.
- False-positive readings often happen when price only wicks through a level and then returns to the prior range.
What Support and Resistance Levels Mean
Support means price has previously found demand near a lower area. Resistance means price has previously found supply near an upper area. These reactions do not prove that buyers or sellers will behave the same way again, but they create a visible area where future price behavior can be compared with earlier behavior.
| Level type | Basic meaning | Safer interpretation |
|---|---|---|
| Support | A lower area where price previously reacted upward or stopped falling. | Evidence that buyers may have defended the area before, not proof that the area will hold again. |
| Resistance | An upper area where price previously reacted downward or stopped rising. | Evidence that sellers may have appeared near the area before, not proof that price must reject again. |
| Zone | A range around prior reactions rather than one exact line. | A more realistic way to read imperfect market behavior, wicks, gaps, and uneven closes. |
Markets rarely respect one price tick cleanly. A wick, close, retest, or brief overshoot can still belong to the same reaction area when the broader structure continues to respond around that zone.
How Support and Resistance Levels Form
Many support and resistance levels begin at prior swing highs, prior swing lows, consolidation edges, or areas where price changed behavior after a strong move. A prior swing low can become a support reference because selling pressure slowed there. A prior swing high can become a resistance reference because buying pressure failed to continue there.
Repeated reactions can improve the visibility of a level, especially when price approaches the same zone from different directions and reacts with clear rejection, pause, or failed continuation. Repetition alone is not enough. A level with many small, messy touches may be less useful than a cleaner area where price reacted decisively several times.
Round numbers can also attract attention because many traders and algorithms cluster orders near obvious prices. They should be treated as secondary cues. A round number without prior price reaction is weaker than a nearby zone that has already shaped market behavior.
How Traders Identify Support and Resistance Levels
Useful levels usually appear where the chart has already shown a reaction. The clearest candidates are areas where price reversed, paused, rejected, reclaimed, or failed to continue. A single touch can create a possible reference, but it usually remains weaker than a zone with repeated and recent reactions.
Diagnostic boundary: A level is not just a horizontal mark on a chart. A stronger reading needs a visible reaction area, enough spacing between tests, and later behavior that still respects the zone. A weaker reading often comes from drawing every small high or low until the chart is crowded with lines.
Recency also changes the reading. A level from the current structure is often more relevant than an old level that price has crossed many times without clean reaction. Older areas can still matter, but only if current price behavior begins to respond near them again.
Support, Resistance, and Role Reversal
Role reversal happens when an old support area begins acting like resistance, or an old resistance area begins acting like support. This shift is possible after price moves beyond a zone and later returns to test it from the other side.
The role shift is not automatic. Old support becomes more defensible as resistance only when price fails to reclaim the area or reacts from below it. Old resistance becomes more defensible as support only when price holds above the area and rejected moves back below it fail to gain acceptance.
A clean role-reversal reading compares the break, the return to the area, and the behavior after the retest. A wick through the zone without sustained acceptance may only show temporary probing, not a completed change in market structure.
Clean, Weak, and False-Positive Readings
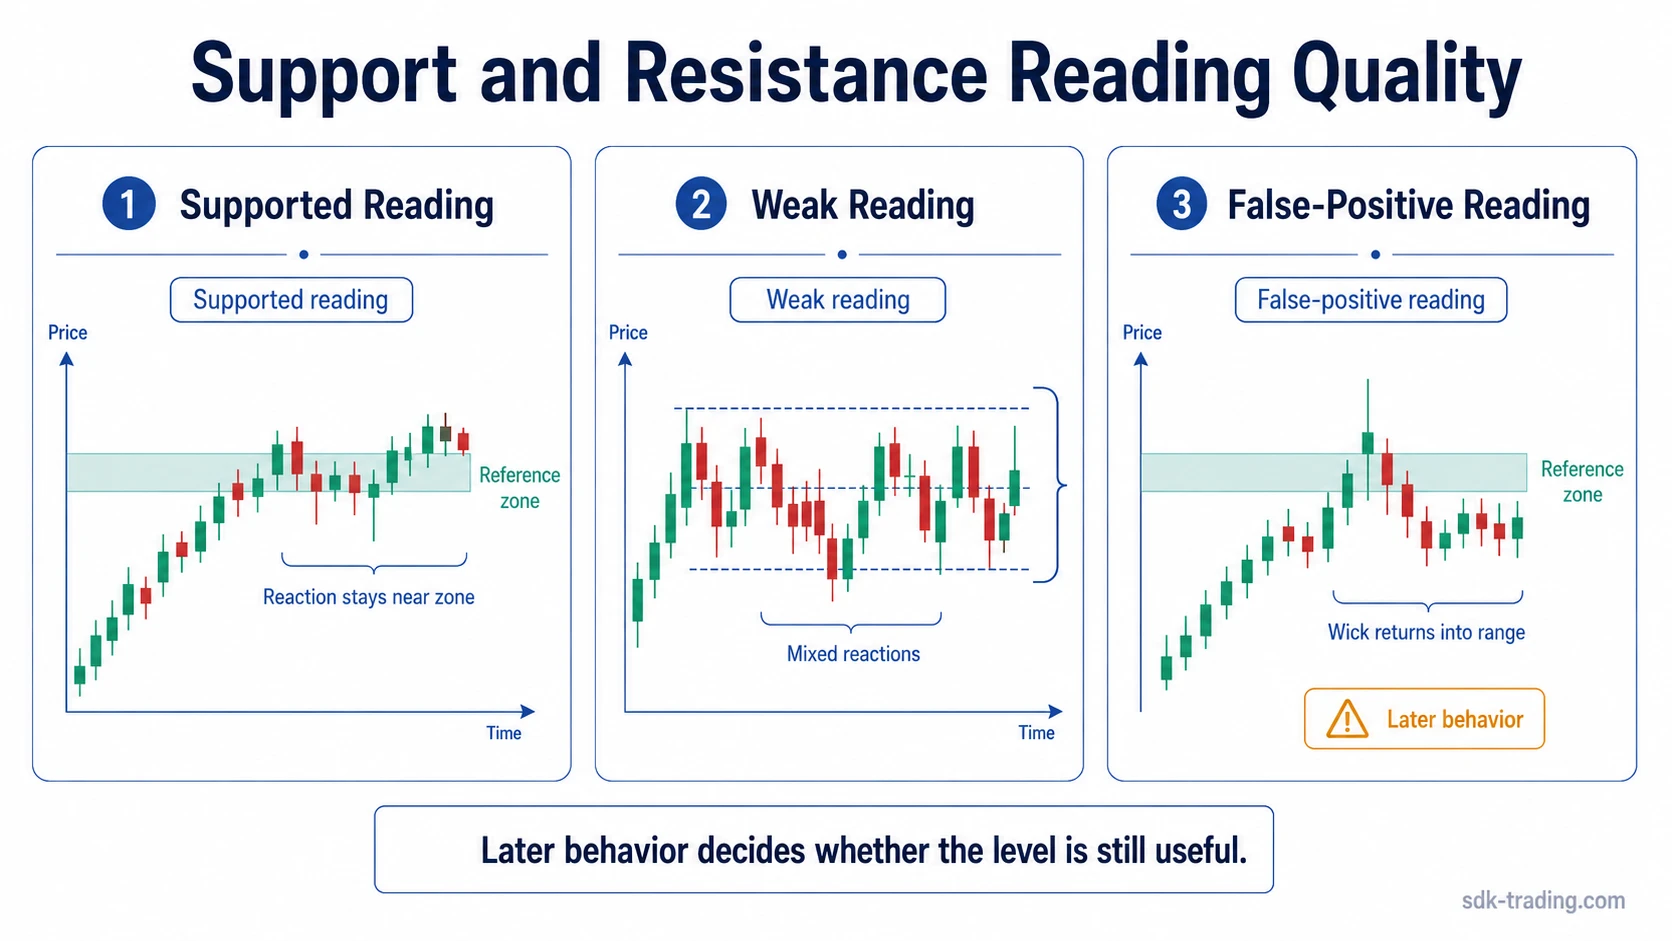
Support and resistance levels are most useful when the quality of the reading is separated from the existence of the line. A visible level can still produce a weak interpretation if the reaction is unclear or if price repeatedly cuts through the zone without respecting it.
| Reading type | What price does | What improves the reading | What weakens it |
|---|---|---|---|
| Clean reading | Price approaches a prior reaction zone and responds with a clear rejection, hold, or failed break. | Several well-spaced reactions, clear closes, and behavior that remains consistent around the same area. | Later price action can still weaken the reading if price starts cutting through the zone without clear reaction. |
| Weak reading | Price touches the area but the reaction is shallow, inconsistent, or mixed with nearby minor levels. | Later tests that clarify whether the area is being accepted or rejected. | Too many lines, stale levels, unclear closes, or reactions that occur far away from the marked zone. |
| False-positive reading | Price wicks through or briefly touches the level, then returns to the prior range without sustained acceptance. | Follow-up behavior that separates a failed break from a real shift in acceptance. | Calling the first touch or first wick decisive before the market has shown how it treats the area afterward. |
When a Support or Resistance Level Breaks
A break through support or resistance is best treated as new evidence. It may mean the level has lost influence, but it may also be a temporary overshoot. The stronger case develops when price accepts beyond the zone, holds there, and later fails to reclaim the old side of the level.
Acceptance matters because a single candle can cross a level without changing the broader structure. If price breaks below support but quickly returns above the zone, the level may still be active or the break may have been a probe. If price breaks below support, fails to reclaim it, and later reacts from underneath, the old support reading is weaker.
Levels can also decay. A support or resistance zone becomes less useful when price repeatedly crosses it without meaningful reaction, when volatility changes the scale of the chart, or when newer reaction areas take control of the structure.
Example of a False-Positive Level Reading: Price reacts several times near a lower area, so the zone becomes visible as possible support. Later, price pierces below the area and closes back inside the prior range. The break alone does not settle the interpretation. Sustained acceptance below the zone would suggest the level has weakened. A failed move lower followed by a return into the range would make the break look less decisive.
Support and Resistance Levels vs Calculated or Indicator-Based Levels
Observed support and resistance levels come from prior chart reactions. Pivot points are different because they calculate fixed reference levels from prior-period high, low, and close data.
Manual level drawing also differs from tools that attempt to detect or plot zones automatically. A tool that plots support and resistance areas can help organize chart references, but the plotted area still needs interpretation through reaction quality, acceptance, failed reclaim, and structure.
| Level source | How it is created | Main limitation |
|---|---|---|
| Observed support and resistance | Drawn from prior reactions, swings, ranges, and tests. | Can become subjective if every minor touch is marked. |
| Calculated levels | Generated from a formula or prior-period data. | May not align with the most meaningful current reaction zone. |
| Indicator-assisted levels | Plotted by rules, algorithms, or charting tools. | Still require judgment around false breaks, acceptance, and level quality. |
Common Mistakes
- Treating a level as one exact price: A better reading usually allows for a zone around the prior reaction.
- Calling every touch meaningful: A minor touch without clear reaction can add clutter instead of clarity.
- Assuming a wick proves rejection: A wick needs follow-up behavior before the interpretation becomes more reliable.
- Calling the first break decisive: A break becomes more meaningful when price accepts beyond the area or fails to reclaim it.
- Turning levels into trade commands: Support and resistance are reference areas for interpretation, not automatic instructions.
Limitation: Support and resistance levels describe where price has reacted before. They do not predict whether price will reverse, continue, hold, or reject. The reading improves only when the level is compared with current structure and later price behavior around the same area.
FAQ
Are support and resistance levels exact prices?
No. Support and resistance levels are usually better read as zones around prior price reactions. Exact lines can make the chart look cleaner, but real price behavior often includes wicks, brief overshoots, and uneven closes.
How do traders find support and resistance levels?
Traders usually look for prior swing highs, prior swing lows, range edges, repeated reactions, and areas where price changed behavior. Cleaner and more recent reactions usually matter more than old or minor touches.
How do you know if a support or resistance level is broken?
A break is more meaningful when price accepts beyond the zone and later fails to reclaim the old side. A quick wick through the area followed by a return into the prior range can be a false-positive break.
Can old support become resistance?
Yes, but only when price behavior supports that role change. Old support becomes a stronger resistance candidate when price breaks below it, returns to the area, and fails to reclaim it.
Can indicators identify support and resistance levels?
Some tools can plot possible support and resistance areas automatically. The plotted levels still need interpretation because the tool cannot guarantee that price will respect, reject, or break the zone.