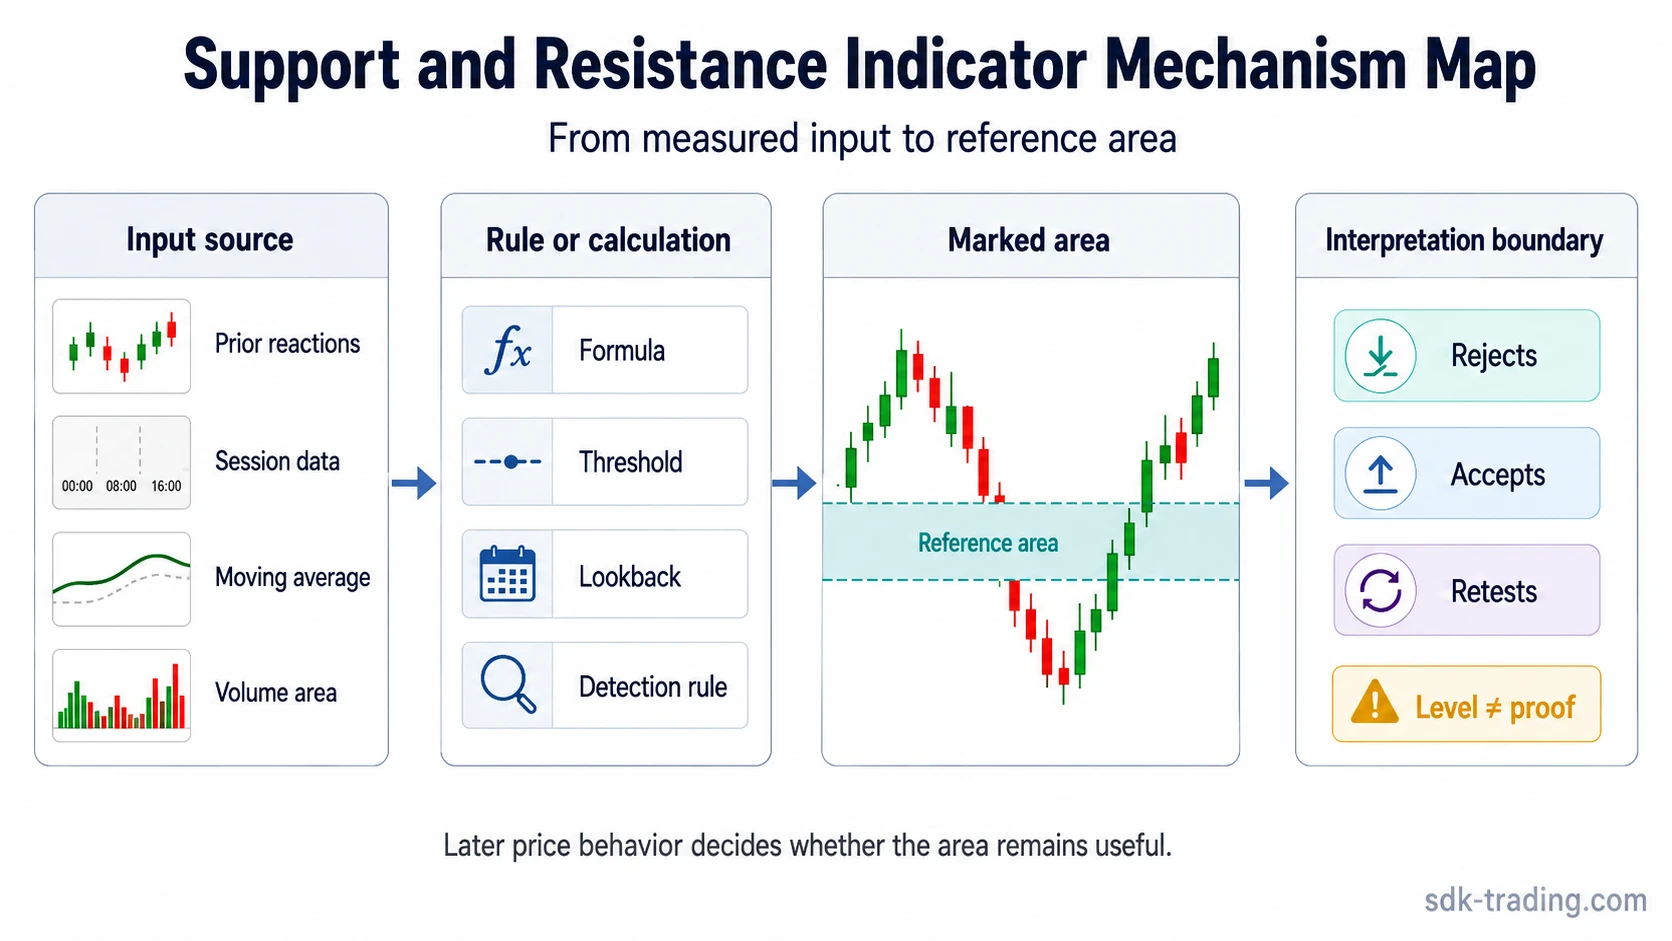
When a support and resistance indicator marks a level, it is translating prior price reactions, formulas, moving averages, volume, volatility, or other rules into a reference area. The mark can help locate where price may react, but the indicator reading does not prove that the area will hold, reject, or change direction.
Definition: A support and resistance indicator is a technical analysis tool that plots likely support or resistance areas from predefined rules, calculations, thresholds, or detected price behavior.
Key Points
- A support and resistance indicator marks a reference area, not a completed market reading.
- Different indicator families measure different inputs, such as session formulas, ratios, moving averages, volume areas, or detected reaction zones.
- Indicator-generated levels can reduce manual subjectivity, but they can also create false confidence when parameters, timeframes, or redraw behavior are unclear.
- The useful question is not only where the line appears, but what price does after it reaches, rejects, accepts, or repeatedly tests the area.
What a Support and Resistance Indicator Shows
A support and resistance indicator shows where a charting tool has identified a possible reaction area. Some indicators calculate fixed levels from a prior session. Others update dynamically as price, volume, volatility, or moving averages change. Auto-drawn tools may scan prior swing points and mark zones where reactions have appeared before.
The reading is useful only when its input is understood. A formula-derived level is different from a moving average, a volume area, or an automatically detected zone. Each method highlights a different type of chart condition, and each can fail for a different reason.
Indicator-Generated Levels vs Manual Support and Resistance Levels
Manual support and resistance levels come from chart interpretation: prior reactions, failed breaks, repeated tests, or visible areas where supply and demand appeared to shift. Indicator-generated levels encode part of that process into a rule, formula, or detection method.
The advantage is consistency. The limitation is that the tool can only measure what it was built to measure. A manual level may include broader market structure and recent behavior, while an indicator may continue plotting a level because its formula or detection rule still says it should.
Practical distinction: manual levels depend on judgment; indicator levels depend on rules. Neither approach removes the need to observe how price behaves around the area after it is marked.
Main Types of Support and Resistance Indicators
Support and resistance indicators are better grouped by what they measure than by which one looks cleaner on a chart. Fixed formulas, dynamic references, volume-based tools, and auto-drawn zones all create different kinds of chart information.
| Indicator family | What it usually measures | Typical output | Main limitation |
|---|---|---|---|
| Pivot points | Prior session price data, usually high, low, close, and formula-derived levels. | Fixed reference levels for the next session or period. | The formula does not know whether current participation still respects the prior session structure. |
| Camarilla pivots | A specialized pivot-point variant using its own level calculation around prior price ranges. | Formula-based intraday support and resistance bands. | The levels can cluster tightly and may be overread when volatility or session character changes. |
| Moving averages | Average price over a selected lookback period. | Dynamic support or resistance reference that moves with price. | The line can lag and may describe a trend only after price has already moved. |
| Fibonacci retracement tools | Ratio levels inside a measured price swing. | Potential pullback reference areas. | The reading depends heavily on anchor selection and swing clarity. |
| Volume or volume profile tools | Activity distribution across prices or selected periods. | Areas where participation was concentrated. | High activity marks participation, not direction by itself. |
| Auto-drawn zones and scripts | Detected reactions, pivots, retests, or programmed thresholds. | Automatically updated levels, bands, or zones. | Settings, timeframe, redraw behavior, and detection rules can change the apparent strength of the zone. |
Condition, Implication, and Limitation
The useful reading starts with a condition. The indicator has marked something measurable; the next step is separating what that condition may imply from what it cannot prove.
| Indicator condition | Possible implication | Common misread | Safer interpretation / limitation |
|---|---|---|---|
| A pivot formula marks a level for the current session. | The area may become a session-based reference point. | Treating the exact number as a guaranteed reaction point. | The reading depends on whether price accepts, rejects, or repeatedly tests the area instead of treating the formula as the interpretation. |
| A moving average overlaps a prior reaction area. | A dynamic reference is aligning with a visible price zone. | Calling the average support or resistance before price behavior responds to it. | The reading becomes more useful only if behavior around the area remains consistent across more than one test. |
| An auto-drawn zone appears after several prior reactions. | The tool has detected repeated activity around a similar area. | Assuming the zone is objective because it was drawn automatically. | Check sensitivity to timeframe, settings, and whether broken zones are removed, redrawn, or left on the chart. |
| A volume area aligns with a price reaction zone. | Participation was concentrated near the area. | Assuming high volume means reversal or rejection. | Volume shows activity; direction still depends on acceptance, rejection, and follow-through behavior. |
| Several indicator levels cluster in the same region. | Different methods are pointing to a similar reference area. | Treating the cluster as stronger simply because more lines overlap. | Overcrowded levels can reflect repeated measurement of the same prior move rather than independent evidence. |
When the Indicator Reading Becomes Weaker
An indicator-generated level becomes weaker when the tool keeps identifying an area that price no longer respects. Repeated tests without rejection, clean acceptance through the zone, or fast redraw behavior can all reduce the usefulness of the original mark.
Parameter sensitivity: a small change in lookback length, sensitivity, session setting, or swing-detection rule can move the level. If the interpretation changes sharply after a minor settings change, the level may be less reliable than it appears.
Lag also matters. Moving averages and some dynamic tools are built from past data, so they may follow a move rather than identify a fresh reaction area. Auto-drawn scripts can create a different problem: the zone may look clean after the fact because the tool updates, removes, or redraws levels as new candles appear.
Timeframe mismatch can distort the reading. A level that appears meaningful on a short-term chart may be noise inside a larger structure, while a higher-timeframe area may be too broad to explain a small intraday reaction cleanly.
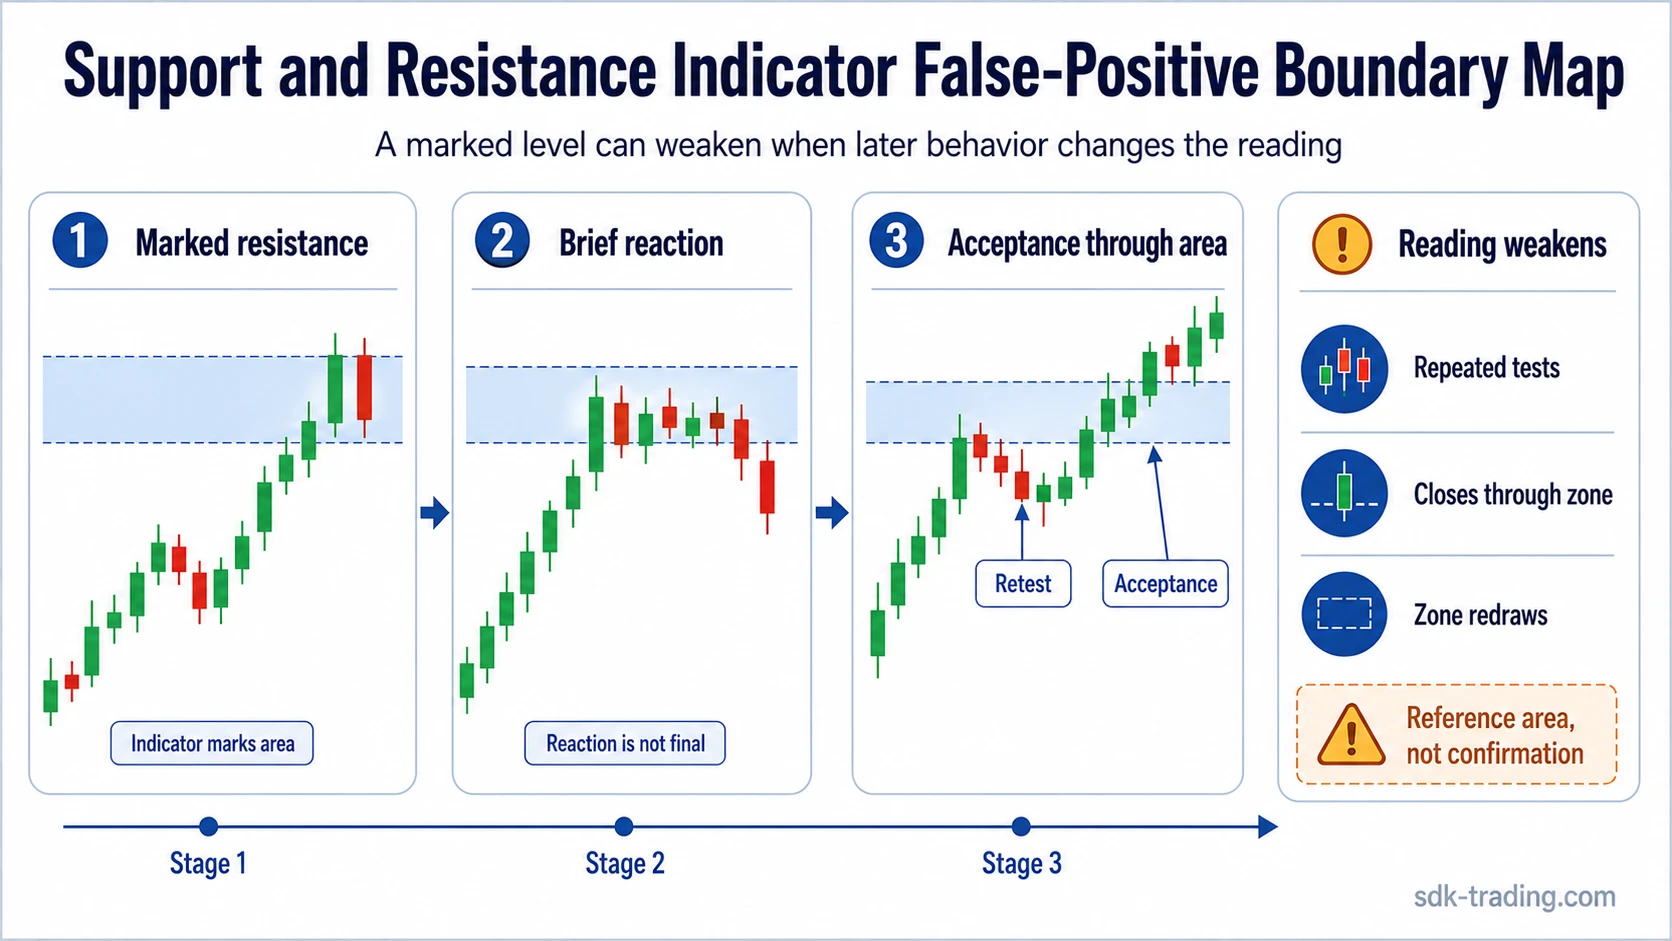
Support and Resistance Indicator False-Positive Example
Price advances into an auto-drawn resistance area created from earlier reactions. The first touch stalls briefly, so the level looks meaningful. The next push trades back into the same area, holds there longer, and begins closing above the marked zone instead of rejecting it.
The indicator identified a reasonable reference area, but the later behavior changed the interpretation. A brief reaction did not settle the question. Acceptance through the area, repeated tests without rejection, or redrawing of the zone weakens the original resistance reading.
This kind of false-positive reading is common when a tool is treated as the answer rather than the starting condition. The line can be useful, but price behavior around the line decides whether the area is still being respected.
Which Support and Resistance Indicator Is Best?
No support and resistance indicator is best in every market condition because each one measures a different input. Pivot formulas, moving averages, Fibonacci ratios, volume areas, and auto-drawn zones do not answer the same question.
A formula-based level may be useful when session structure matters. A moving average may be more relevant when price is trending smoothly. A volume-based level may help identify where participation concentrated. An automatic zone tool may help scan repeated reactions, but only if its rules and redraw behavior are understood.
The better question is what the indicator is measuring, how stable the output is, and what would make the marked area lose relevance.
FAQ
What indicator shows support and resistance?
Several indicator types can show support and resistance areas, including pivot points, moving averages, Fibonacci tools, volume profile tools, and auto-drawn zone indicators. They do not measure the same thing, so the output should be interpreted according to the method behind it.
Can a support and resistance indicator replace manual levels?
A support and resistance indicator can make level marking more consistent, but it cannot replace all chart interpretation. Manual levels can include broader structure, recent acceptance, failed breaks, and context that a formula or script may not fully capture.
Are support and resistance indicators exact price levels?
Support and resistance indicators are better treated as zones or reference areas. Exact-line readings can become misleading when spreads, volatility, liquidity, or repeated tests shift the practical reaction area.
Why do support and resistance indicators give false readings?
False readings can appear when parameters are too sensitive, levels lag current behavior, zones are redrawn, or price accepts through a marked area instead of reacting from it. The indicator marks a condition; later behavior decides whether that condition remains useful.
How to Read Indicator-Generated Levels Safely
A support and resistance indicator is most useful when the marked area is treated as a question: which input created the level, how stable is that input, and what later behavior would weaken the reading? Formula-driven levels, dynamic references, and auto-drawn zones can all organize a chart, but they do not remove the need to judge acceptance, rejection, repeated testing, and redraw behavior.
The practical distinction is simple: the indicator can identify a condition, while the later chart behavior decides whether that condition still deserves attention. That keeps the reading focused on mechanism and limitation rather than treating a plotted line as a finished conclusion.