Volume in trading measures the amount of market activity behind a price move. The useful question is not only whether volume is high or low, but which volume tool fits the problem: raw traded volume, volume at price, volume-weighted price, cumulative participation, money-flow behavior, or volume momentum.
Definition: Trading volume measures how much of an asset changes hands during a selected period. It describes participation intensity, not direction by itself. A volume reading becomes more useful when it is compared with price movement, range, location, and the specific volume indicator being used.
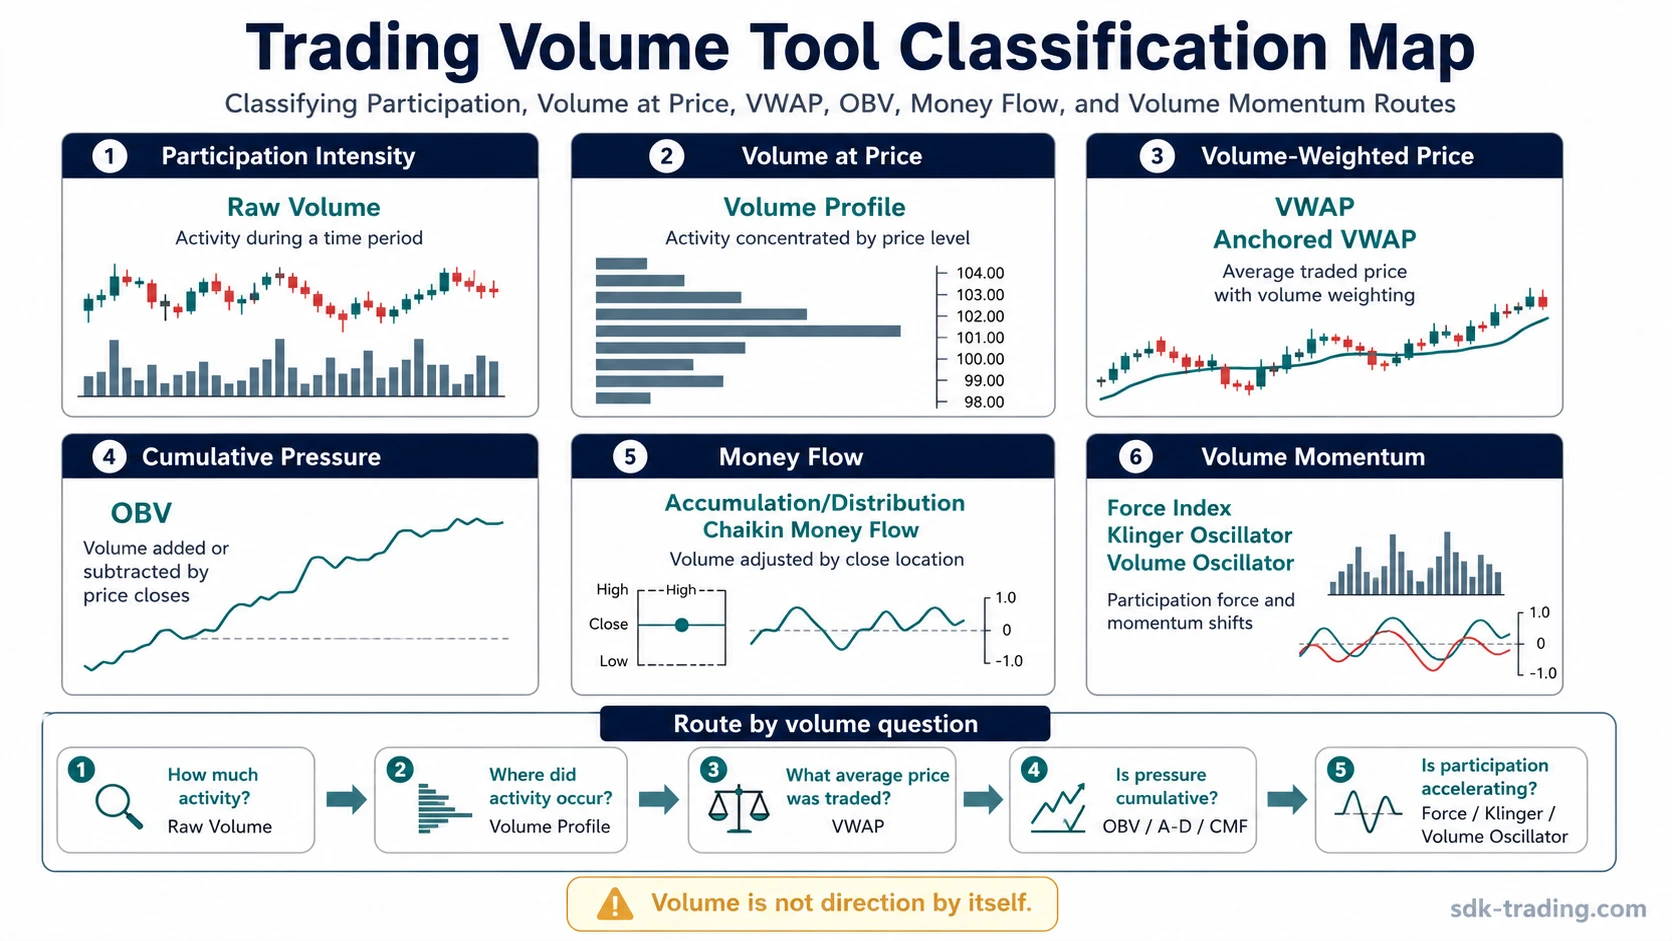
In technical analysis, volume is a market-participation input that routes into several different indicator families. The same volume spike can mean different things depending on whether the reader is studying activity intensity, price-level acceptance, volume-weighted price, cumulative pressure, or volume momentum.
Key Points
- Raw trading volume shows activity during a time period, but it does not explain direction by itself.
- Volume Profile and other volume-at-price tools reorganize activity by price level instead of only by time.
- VWAP and Anchored VWAP connect traded volume with average traded price over a selected session or anchor point.
- OBV, Accumulation/Distribution, Chaikin Money Flow, Force Index, Klinger Oscillator, and Volume Oscillator each transform volume through a different calculation lens.
Trading Volume Choice Map
Some volume tools answer how much activity happened, while others answer where it happened, how price behaved with that activity, or whether participation is expanding or fading.
| Reader question | Best route | What the tool mainly measures |
|---|---|---|
| Where did the most activity occur by price level? | Volume Profile | Volume distributed across price levels rather than only time periods. |
| What is the average traded price adjusted by volume? | VWAP | Volume-weighted average price for a defined trading window. |
| How does VWAP change when the start point is chosen manually? | Anchored VWAP | Volume-weighted average price from a selected event, swing, or reference point. |
| Is cumulative volume pressure rising or falling with price direction? | OBV | Cumulative volume added or subtracted according to price closes. |
| How does price location inside the range affect volume interpretation? | Accumulation/Distribution | Volume weighted by where the close sits inside the period range. |
| Is money flow strengthening or weakening over a lookback window? | Chaikin Money Flow | Volume-adjusted accumulation or distribution pressure over time. |
| How much force is behind a price move? | Force Index | Price change multiplied by volume to estimate movement force. |
| Is volume momentum expanding or contracting? | Volume Oscillator | Difference between shorter and longer volume averages. |
| How does longer-term money-flow behavior compare with shorter-term movement? | Klinger Oscillator | Volume-force behavior across trend and shorter-term fluctuation. |
Volume Effort Versus Price Result
A volume reading becomes more useful when it is compared with the price result that followed it. Strong volume with only a small price advance can describe heavy participation, but it does not automatically explain whether demand absorbed supply or whether supply resisted the move. Low volume with a large price move can also be unstable because less participation was needed to move price.
This effort-versus-result lens keeps volume from becoming a one-word conclusion. Volume expansion, volume contraction, and price response should be read together. A reader looking for participation quality can stay with volume indicators, while a reader trying to locate accepted price areas should use Volume Profile or VWAP-style tools.
Volume reading filter: First identify whether the question is about activity intensity, activity location, volume-weighted price, cumulative pressure, or volume momentum. The same volume spike can lead to different interpretations depending on which of those questions is being asked.
Volume Indicators and Volume-at-Price Tools Are Not the Same
Volume indicators usually transform time-based volume data into a line, oscillator, histogram, or cumulative reading. Volume Profile is different because it reorganizes activity by price level. That distinction matters because a reader asking where market participation concentrated is not asking the same question as a reader asking whether participation is expanding over time.
| Tool family | Primary lens | Common misread |
|---|---|---|
| Raw volume bars | Activity per candle or time period. | Reading activity as bullish or bearish without price response. |
| Volume Profile | Activity by price level. | Treating high-volume areas as guaranteed support or resistance. |
| VWAP and Anchored VWAP | Volume-weighted average price. | Using the line as a fixed signal instead of a reference benchmark. |
| Cumulative volume indicators | Running participation pressure. | Assuming the line must match price tick for tick. |
| Volume oscillators | Shorter-term volume momentum versus longer-term participation. | Confusing volume momentum with price momentum. |
Related Volume Frameworks
Broader volume questions often involve comparison, workflow, or higher-level interpretation rather than one indicator definition.
| Reader problem | Best route | Use when |
|---|---|---|
| The reader needs an overview of the indicator family. | Volume indicators explained | The question is about the category, not one specific formula. |
| The reader wants to understand how Volume Profile is used conceptually. | How to Use Volume Profile | The question has moved from definition into interpretation workflow. |
| The reader is comparing cumulative volume pressure tools. | OBV vs Accumulation/Distribution | The issue is how two cumulative tools process volume and price location differently. |
| The reader wants a VWAP-based framework. | VWAP strategy framework | The question is about conditional interpretation, not the definition of VWAP. |
| The reader is comparing a volume-weighted benchmark with a simple average. | VWAP vs Moving Average | The issue is volume-weighted price versus time-based smoothing. |
Matching Volume Tools to the Right Problem
Raw volume fits participation-intensity questions. Volume Profile fits activity-location questions. VWAP and Anchored VWAP fit volume-weighted price reference questions. OBV, Accumulation/Distribution, Chaikin Money Flow, Force Index, Klinger Oscillator, and Volume Oscillator fit formula-based questions about how volume behavior changes over time.
The boundary matters because volume is not one indicator. It is the source input for a group of tools. The reading becomes cleaner when the tool matches the problem instead of forcing every volume question into the same high-volume-versus-low-volume frame.