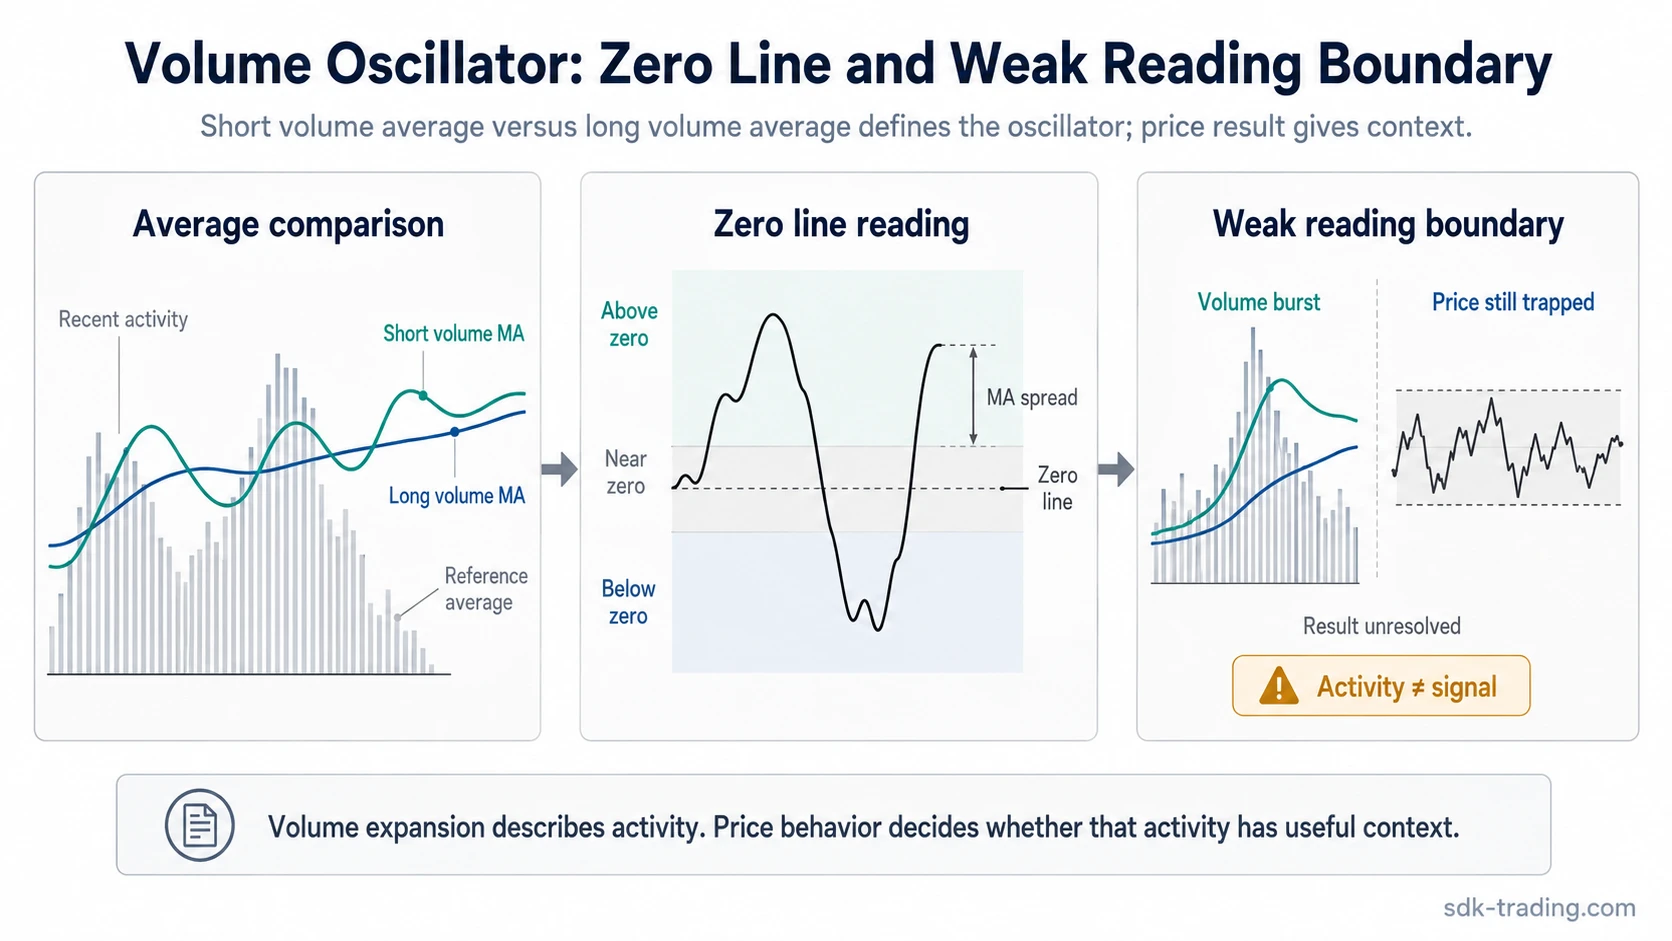
A Volume Oscillator compares a short-term volume moving average with a longer-term volume moving average to show whether recent trading activity is expanding or contracting.
When the short-term average is above the longer-term average, the oscillator is usually above zero. When the short-term average is below the longer-term average, the oscillator is usually below zero. The reading describes volume momentum, not price direction or trade quality by itself.
Definition: The Volume Oscillator is a technical analysis indicator that measures the difference between a shorter volume average and a longer volume average, usually as either a raw difference or a percentage spread.
Key Points
- The Volume Oscillator compares recent volume against a longer volume average.
- The zero line shows whether the short-term volume average is above or below the longer-term average.
- A high reading still needs price context because a volume burst can be temporary, distorted, or poorly supported by price behavior.
What Is the Volume Oscillator?
The Volume Oscillator is a volume momentum indicator. It does not count cumulative volume like OBV and it does not map volume by price level. Its main job is to compare recent activity with a slower reference average so the chart can show expansion, contraction, or a return toward normal volume.
A rising oscillator means the shorter volume average is gaining relative to the longer average. A falling oscillator means recent volume is losing relative strength. The reading is more useful when it is compared with price behavior, range expansion, liquidity quality, and the market structure around the move.
Volume Oscillator Formula
The common percentage version of the Volume Oscillator subtracts the long volume moving average from the short volume moving average, then divides the result by the long volume moving average.
| Version | Formula | What it expresses |
|---|---|---|
| Percentage version | ((Short Volume MA – Long Volume MA) / Long Volume MA) x 100 | The short average as a percentage distance above or below the long average. |
| Raw difference version | Short Volume MA – Long Volume MA | The direct volume-unit difference between the two averages. |
Platforms may allow different moving-average types or periods. The interpretation still depends on the same boundary: recent volume is being measured against a slower participation reference.
How the Zero Line Works
The zero line is the point where the short-term and long-term volume averages are equal. It is a mathematical reference line, not a trade trigger.
| Reading | Volume condition | Interpretation boundary |
|---|---|---|
| Above zero | Short-term volume average is above the longer-term average. | Recent activity is stronger than the reference average, but price direction still needs separate evidence. |
| Near zero | The two volume averages are close together. | Recent volume is close to the longer average and may be noisy or indecisive. |
| Below zero | Short-term volume average is below the longer-term average. | Recent activity is weaker than the reference average, but lower volume does not automatically define trend quality. |
| Crossing zero | The short-term average moves from one side of the long-term average to the other. | The relationship between recent volume and longer-term volume has changed; surrounding price behavior decides whether that change matters. |
What the Volume Oscillator Shows About Volume Expansion and Contraction
Volume expansion means recent activity is increasing compared with the longer average. Volume contraction means recent activity is fading compared with that average. The oscillator helps make that relationship visible, especially when raw volume bars are uneven or difficult to compare by eye.
The stronger question is effort versus result. A rising Volume Oscillator with wider price ranges and cleaner acceptance can describe broader participation. A rising oscillator while price stalls, rejects a tested area, or remains trapped can describe effort that is not producing a durable result.
A large volume reading is more informative when price behavior also changes. If volume expands but price remains stuck inside a narrow range, the oscillator may be describing activity without clear directional acceptance.
Clean, Weak, and Misleading Volume Oscillator Readings
A Volume Oscillator reading becomes clearer when volume behavior and price behavior point in the same direction. It becomes weaker when the oscillator moves sharply but the chart does not show matching acceptance or follow-through.
| Reading type | Typical condition | Safer interpretation |
|---|---|---|
| Clean reading | Recent volume expands and price behavior also shows broader participation. | The oscillator is aligned with visible market activity, but it still does not define a complete trading decision. |
| Weak reading | The oscillator rises while price remains compressed, hesitant, or unable to hold tested areas. | Volume has increased, but the result is not strong enough to treat the reading as meaningful confirmation by itself. |
| Misleading reading | A one-off volume burst or low-liquidity spike lifts the short average. | The reading may reflect temporary activity rather than sustained participation. |
Volume Oscillator example in context: Price advances into a prior resistance area and volume suddenly expands, pushing the oscillator above zero. The move looks more active, but the candle closes back inside the prior range and the next recovery attempt stalls. The oscillator is showing a volume burst, while price behavior leaves the participation reading unresolved.
Volume Oscillator Diagnostic Boundary Map
The Volume Oscillator is strongest as a boundary tool: it separates volume expansion from volume contraction, then leaves price behavior to answer whether that expansion is useful.
| Boundary | Safe explanation |
|---|---|
| What it is | A short-vs-long volume moving-average spread that shows whether recent participation is above or below a slower reference average. |
| What it is not | Not a cumulative close-direction volume line, not a volume-by-price map, and not proof of future price direction. |
| What strengthens it | Sustained volume expansion combined with price behavior that supports broader participation or cleaner acceptance. |
| What weakens it | Low-liquidity spikes, sideways chop, parameter whipsaw, and volume bursts that do not create a meaningful price result. |
Volume Oscillator vs OBV, Klinger Oscillator, and Volume Profile
OBV, Klinger Oscillator, Volume Profile, and the Volume Oscillator all use volume, but they answer different chart-reading questions. Treating them as interchangeable can blur the difference between participation momentum, cumulative flow, and volume location.
| Tool | Main input logic | Main distinction |
|---|---|---|
| Volume Oscillator | Short-term volume average compared with a longer-term volume average. | Shows recent volume momentum relative to longer-term volume. |
| OBV | Cumulative volume added or subtracted by close direction. | Tracks close-direction volume flow rather than moving-average volume spread. |
| Klinger Oscillator | Volume force logic built around trend and money-flow style interpretation. | Uses a broader oscillator construction than the Volume Oscillator’s simple short-vs-long volume average comparison. |
| Volume-by-price participation zones | Volume distributed across price levels. | Shows where activity concentrated by price, rather than whether recent volume is above or below a time-based average. |
Different volume indicators measure different participation questions, including direction-based flow, price-level participation, volume force, and moving-average volume momentum.
Common Mistakes When Reading the Volume Oscillator
A common mistake is treating a zero-line cross as a completed interpretation. The cross only says that the short-term volume average has moved above or below the longer-term average. It does not say whether price has accepted a new area, whether the move has quality, or whether broader participation is durable.
Another mistake is reading volume expansion as confirmation without checking the result. High activity near the upper part of a move can be less constructive if price begins to slow, volatility widens, and repeated attempts fail to extend cleanly. The amount of volume matters, but its placement and result matter too.
Common mistake: A positive oscillator reading describes stronger recent volume than longer-term volume. It does not automatically confirm accumulation, continuation, reversal, or trade quality.
Volume Oscillator Settings and Data Quality Limits
Shorter settings make the oscillator more reactive. Longer settings make it smoother but slower to reflect sudden activity changes. Neither choice is universally better because the right sensitivity depends on the instrument, volume quality, chart interval, and the question being asked.
| Input or limit | Effect on the reading | Why it matters |
|---|---|---|
| Short moving-average period | Responds faster to recent volume changes. | Can create more whipsaw around short volume bursts. |
| Long moving-average period | Smooths the reference average. | Can lag when participation changes quickly. |
| Low-liquidity volume spikes | Can push the oscillator sharply above or below normal. | May distort the reading if price behavior does not support the same interpretation. |
| Sideways chop | Can produce repeated crosses around zero. | Near-zero movement may reflect noise rather than a meaningful participation shift. |
| Volume data quality | Different markets and feeds can report volume differently. | The oscillator is only as reliable as the volume data behind it. |
Limitation: The Volume Oscillator is a participation measure. It can support a volume reading, but it cannot replace price structure, liquidity context, or separate risk analysis.
When a Volume Oscillator Reading Becomes Less Useful
The oscillator is less useful when a short volume burst changes the average faster than price structure changes around it. A spike can move the line above zero while price still shows failed acceptance, narrow range behavior, or poor continuation.
Climax risk is the main boundary. A sharp volume expansion can mark increased activity, but if price result weakens, the same expansion may describe temporary effort rather than durable participation.
FAQ
What does the zero line mean on the Volume Oscillator?
The zero line means the short-term and long-term volume averages are equal. Above zero, the short average is higher. Below zero, the short average is lower.
Is a positive Volume Oscillator reading bullish?
A positive reading only shows stronger recent volume relative to the longer average. Price direction, acceptance, and broader context must be read separately.
Why can a Volume Oscillator reading be misleading?
A short volume spike, thin liquidity, or sideways chop can move the oscillator without creating a meaningful price result. The reading is weaker when volume changes but price behavior does not support the same interpretation.
How is the Volume Oscillator different from OBV?
The Volume Oscillator compares short and long volume averages. OBV is cumulative and changes based on whether price closes higher or lower than the previous close.