Volume Profile maps traded volume by price level inside a selected range or session. It is different from time-based volume bars, momentum oscillators, cumulative volume lines, and VWAP-style averages because its main output is a price-level distribution, not a directional reading by itself.
The profile window defines the market history being measured. A profile drawn across one session, one visible chart range, or one custom range can produce different point of control, value area, high-volume node, and low-volume node readings because each version measures a different sample of traded activity.
Key Points
- Volume Profile organizes volume by price level, not by time period.
- The profile window defines which trades are included in the distribution.
- The point of control marks the highest-volume price level inside the selected profile.
- Value area, high-volume nodes, and low-volume nodes describe participation density, not future price direction.
- The reading becomes weaker when data quality, session completeness, range selection, or row granularity distort the histogram.
What Is Volume Profile?
Volume Profile is a volume indicator that displays how much trading activity occurred at different price levels. Instead of showing volume as vertical bars under each candle, it builds a horizontal histogram beside the chart so the distribution can be read across price.
A typical profile takes all trades inside the chosen range, groups them into price rows, and shows where participation was thick or thin. Large histogram rows mean more volume accumulated near that price level. Smaller rows mean less volume accumulated there.
This makes Volume Profile a distribution map. It can show where a market spent more or less traded activity inside a chosen sample, but the sample has to be clear before the histogram can be interpreted cleanly. A profile drawn from a full regular session can differ from a profile drawn from only the visible chart area because the included market history is different.
What Volume Profile Is Not
Volume Profile is often misread when its horizontal shape is treated like a forecast. The profile describes where volume accumulated inside a selected profile window. It does not say that price must move toward, reject, or reverse from any level.
Volume Profile as a Boundary:
| It is | It is not |
|---|---|
| A volume-by-price distribution. | A time-based volume bar. |
| A horizontal histogram of participation density. | A momentum oscillator. |
| A way to inspect POC, value area, HVN, and LVN inside a defined sample. | A complete trade setup or forecast. |
| A sample-dependent reading. | A fixed market truth that stays the same across every range or session. |
That boundary also separates Volume Profile from nearby volume tools. Volume Oscillator compares volume moving averages, while Volume Profile groups volume at price levels. OBV accumulates volume based on close direction. VWAP calculates an average price weighted by volume. Anchored VWAP starts that weighted average from a chosen anchor. Force Index combines close-to-close price change with volume. Chaikin Money Flow weights volume by where the close sits inside the period’s high-low range.
How Volume Profile Is Calculated
The calculation begins with the selected range or session. That range defines which candles, trades, or volume records are included. The platform then assigns volume to price levels within that range and groups those levels into rows or bins.
The result is a horizontal histogram. Each row represents a price area, and the row length represents how much volume accumulated there. The highest-volume row becomes the point of control. The area containing a selected share of the profile’s volume becomes the value area, often using a 70% convention, although platforms and settings may vary.
Calculation Flow:
- Select the profile window: session, visible range, fixed range, or custom range.
- Collect volume data only from the included window.
- Group volume into price rows based on the platform’s row or tick setting.
- Plot the horizontal histogram from the aggregated volume at each price level.
- Identify the point of control, value area, high-volume nodes, and low-volume nodes from that distribution.
The reading changes when the measured window changes. It also changes when the row size is adjusted. A very coarse row setting can merge distinct participation areas into one wide band. A very fine row setting can make the distribution look fragmented even when the broader price-level distribution is still readable.
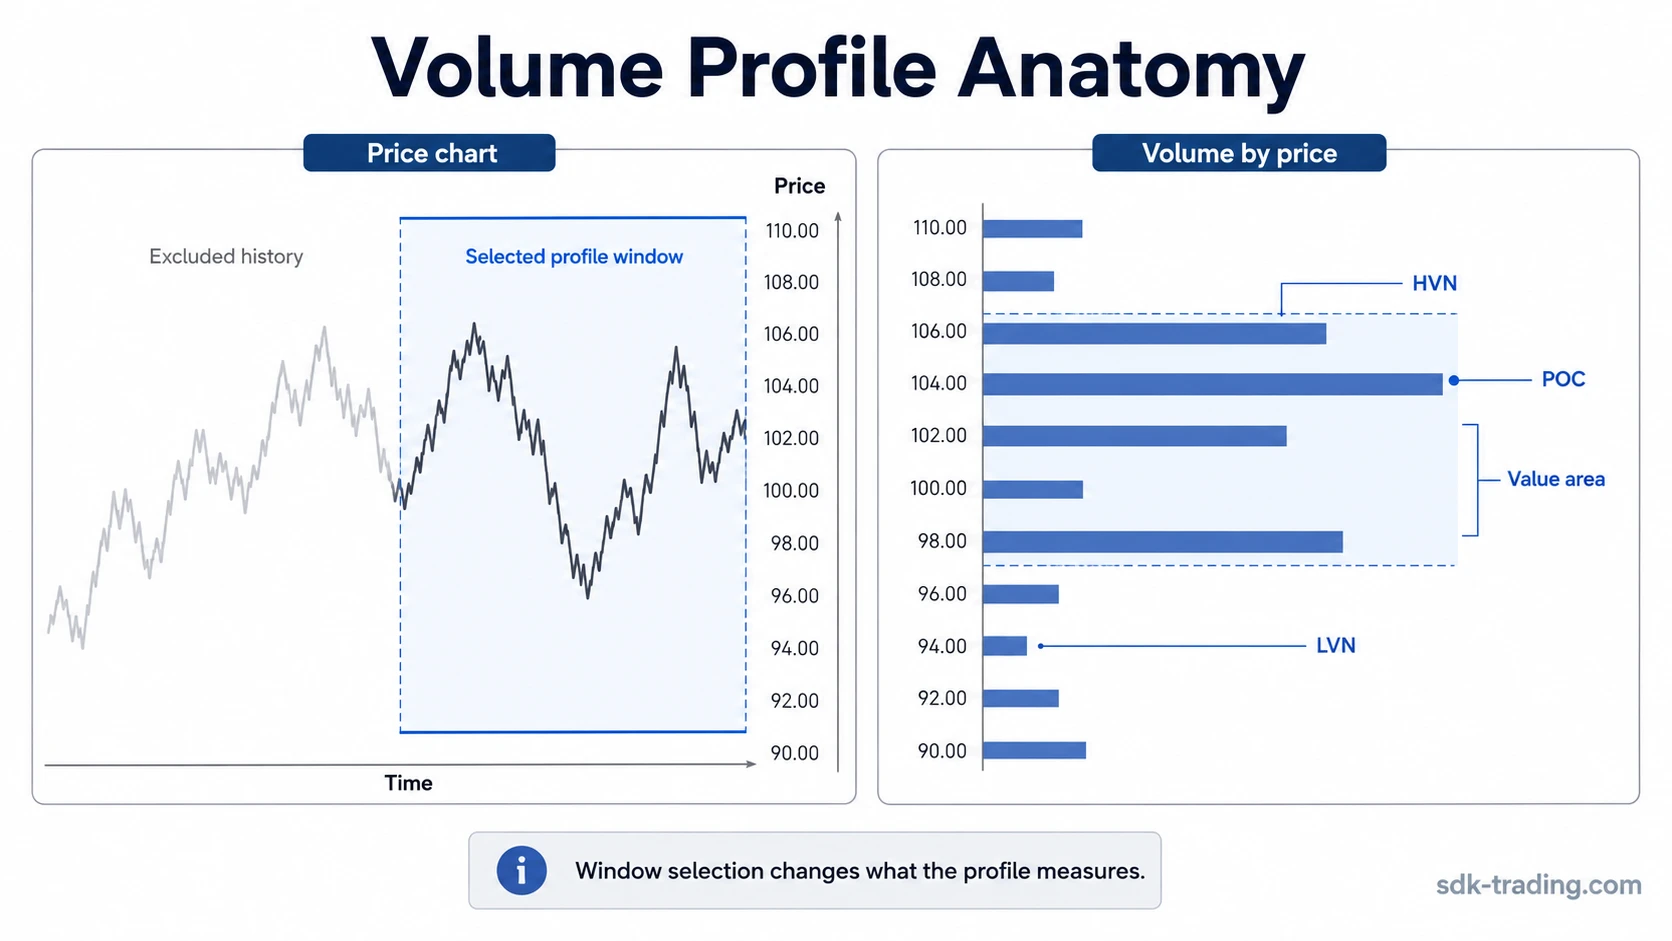
Point of Control, Value Area, HVN and LVN
The main Volume Profile components describe where participation was concentrated, where it was thinner, and how much of the selected range’s volume sits inside the central distribution.
| Component | Meaning | Boundary |
|---|---|---|
| Point of Control | The price level or row with the highest aggregated volume inside the selected profile. | It marks the highest-volume area in that sample, not a forecast by itself. |
| Value Area | The price region containing a chosen share of the profile’s volume, commonly 70%. | The percentage is a convention and can be configurable or platform-dependent. |
| VAH | Value Area High, the upper boundary of the value area. | It is a distribution boundary, not automatic resistance. |
| VAL | Value Area Low, the lower boundary of the value area. | It is a distribution boundary, not automatic support. |
| High-Volume Node | A price area where the histogram shows relatively thick participation. | The node only describes where volume accumulated inside the chosen sample. |
| Low-Volume Node | A price area where the histogram shows relatively thin participation. | Thin participation does not guarantee fast movement through that area. |
The point of control is often the most visible part of the profile, but it is not the entire reading. A profile with one dominant POC has a different structure from a profile with several high-volume nodes separated by low-volume areas. The distribution shape can be more informative than any single line.
Why the Selected Profile Window Changes the Reading
Volume Profile has profile period dependency. A session profile, visible-range profile, fixed-range profile, and custom-range profile can all be mathematically valid while describing different market history.
A session profile includes activity from a defined trading session. A visible-range profile changes as the chart is zoomed or moved. A fixed-range profile starts and ends where the user places it. A custom range can isolate a specific structure, but it can also exclude participation that would change the histogram.
The selected range excludes everything outside the profile window. That is useful when the goal is to inspect a specific phase of activity, but it becomes risky when the window is chosen casually. A narrow range can overemphasize local volume. A stale range can include old participation that no longer describes the current auction. An unfinished session can make the value area and point of control look more stable than they are.
Range-Selection Sensitivity: The same chart can produce different profiles if the sample changes from the full session to the visible chart, from the visible chart to a fixed range, or from a broad range to a narrow local swing. The profile is only as meaningful as the selected market history.
When Volume Profile Readings Become Weak
A clean Volume Profile reading depends on adequate data, a relevant range, readable granularity, and a profile window that includes the participation being interpreted. When those inputs weaken, the profile can still display a histogram, but the histogram may no longer support a strong interpretation.
| Reading condition | What it means | Safer interpretation |
|---|---|---|
| Clean reading | The range is relevant, volume data is adequate, row size is readable, and POC/value area/nodes are stable enough to inspect. | The profile can describe where traded volume concentrated inside that selected window. |
| Weak reading | The session is unfinished, the range is too narrow, the data is thin, or row size distorts the histogram. | The profile may show temporary distribution rather than meaningful participation density. |
| Invalid reading | POC, HVN, LVN, or value-area boundaries are treated as automatic prediction, support, resistance, or trade instruction. | The reading has crossed from distribution analysis into unsupported certainty. |
The profile becomes weaker when the selected range excludes relevant participation. It also becomes weaker when volume data is incomplete, when a platform uses a different allocation method, when non-standard chart types distort the sample, or when chart clutter makes the histogram look more precise than it is.
Volume Profile vs Other Volume Indicators
Volume indicators can use the same market activity but organize it through different calculation lenses. Volume Profile is built around price-level distribution. Other tools may use time, close direction, average price, close location, or moving-average comparison instead.
| Tool | Main calculation lens | Primary reading |
|---|---|---|
| Volume Profile | Volume grouped by price level inside a selected range or session. | Where traded volume accumulated by price. |
| OBV | Cumulative volume added or subtracted based on close direction. | Whether volume is accumulating through up closes or down closes. |
| VWAP | Average price weighted by volume over a period. | Where the volume-weighted average price sits for that period. |
| Anchored VWAP | Volume-weighted average price starting from a selected anchor point. | How price relates to a volume-weighted average from that anchor. |
| Force Index | Close-to-close price change multiplied by volume. | How price change and volume combine in one period or smoothing window. |
| Chaikin Money Flow | Close location within the period’s high-low range, weighted by volume. | Where the close sits within the period’s range and how much volume occurred. |
| Volume Oscillator | Relationship between shorter and longer volume moving averages. | Whether recent volume is expanding or contracting versus its benchmark. |
The key distinction is that Volume Profile does not ask whether volume increased over time or whether a close was higher than the prior close. It asks where volume accumulated by price inside the selected profile window.
Common Volume Profile Misreadings
A common misunderstanding is treating the point of control as the only important part of the profile. The POC is simply the highest-volume row inside the chosen sample. The surrounding value area, nearby high-volume nodes, low-volume areas, and the profile shape can change the reading.
Another mistake is treating HVN and LVN areas as automatic reaction levels. A high-volume node means participation was relatively dense there. A low-volume node means participation was relatively thin there. Neither one proves what price will do next.
A third mistake is ignoring the selected profile window. A profile drawn from a quiet partial session can look clean while excluding the prior activity that shaped the broader distribution. A profile drawn from too wide a range can bury recent changes under older participation. Both versions can be technically valid and still weak for the question being asked.
Volume Profile also becomes easy to overread when the histogram is visually precise. A line, node, or boundary can look exact even when the underlying data, tick size, row setting, or session template is approximate. The boundary fails when price interaction is read as prediction rather than distribution.
Related Concepts
How to use Volume Profile belongs to the practical interpretation layer of the topic, where selected range, reading quality, and common mistakes can be organized into a more applied workflow without changing what the indicator measures.
The distinction from visible order-book depth helps separate displayed liquidity from historical volume distribution. Volume Profile uses traded volume that has already occurred, while order-book depth describes available orders visible at different prices.
FAQ
What does Volume Profile show?
Volume Profile shows how traded volume is distributed across price levels inside a selected range or session. Its histogram highlights where participation was relatively dense or thin in that sample.
What is the point of control in Volume Profile?
The point of control is the price level or row with the highest aggregated volume inside the selected profile. It identifies the highest-volume area in that sample, not a forecast by itself.
What is the value area in Volume Profile?
The value area is the region that contains a chosen share of the profile’s volume, commonly 70%. The exact calculation can vary by platform and settings.
Why can two Volume Profiles look different on the same chart?
Two profiles can look different because the selected profile window, session template, data source, and row granularity can all change which volume is included and how it is grouped by price.