Volume Profile is used by separating effort from result. Effort is where volume clustered by price. Result is how price behaves when it returns to those areas, accepts them, rejects them, pauses near them, or moves through them.
A volume profile reading can help frame participation zones, but the level itself is not a trade decision. POC, value area, HVN, and LVN become more useful when they are compared with current price behavior instead of treated as automatic support, resistance, breakout, or reversal points.
Key Points
- Volume Profile shows where volume accumulated by price, not by time.
- POC, value area, VAH, VAL, HVN, and LVN are reference areas.
- The effort-versus-result reading compares prior participation with current price behavior.
- A touch of a profile level does not prove direction, timing, confirmation, or trade quality.
- The selected profile range, data source, and current auction context can change the reading.
What Volume Profile Shows by Price
Volume Profile organizes traded volume along the price axis. A regular volume histogram shows how much activity occurred during a candle or session. Volume Profile shows where that activity accumulated across price levels inside the selected range.
The selected range matters. A session profile, fixed-range profile, visible-range profile, or anchored profile can show different participation zones because each one measures a different slice of market history. The reading is therefore tied to the chosen profile, the data source, and the current market context.
Volume by price answers: “Where did participation cluster?” It does not answer by itself: “Where should a trade begin?” or “Where must price reverse?”
The Effort-Versus-Result Reading
A safer way to read Volume Profile is to compare volume effort with price result. A large volume cluster shows that a lot of activity occurred near a price area. The next question is whether current behavior confirms, rejects, or ignores that earlier participation area.
If price returns to a high-volume area and pauses, the market may be showing two-sided interest around a familiar participation zone. If price returns to that area and is quickly rejected, the same level may be acting more like a failed acceptance area. If price moves through the area and continues to hold beyond it, the earlier volume cluster may be less important than the new acceptance behavior.
The level is the reference. The reaction is the interpretation. A touch without follow-through can be noise, especially when the profile is old, the range is too wide, or the current session is being driven by new information that is not visible in the historical profile.
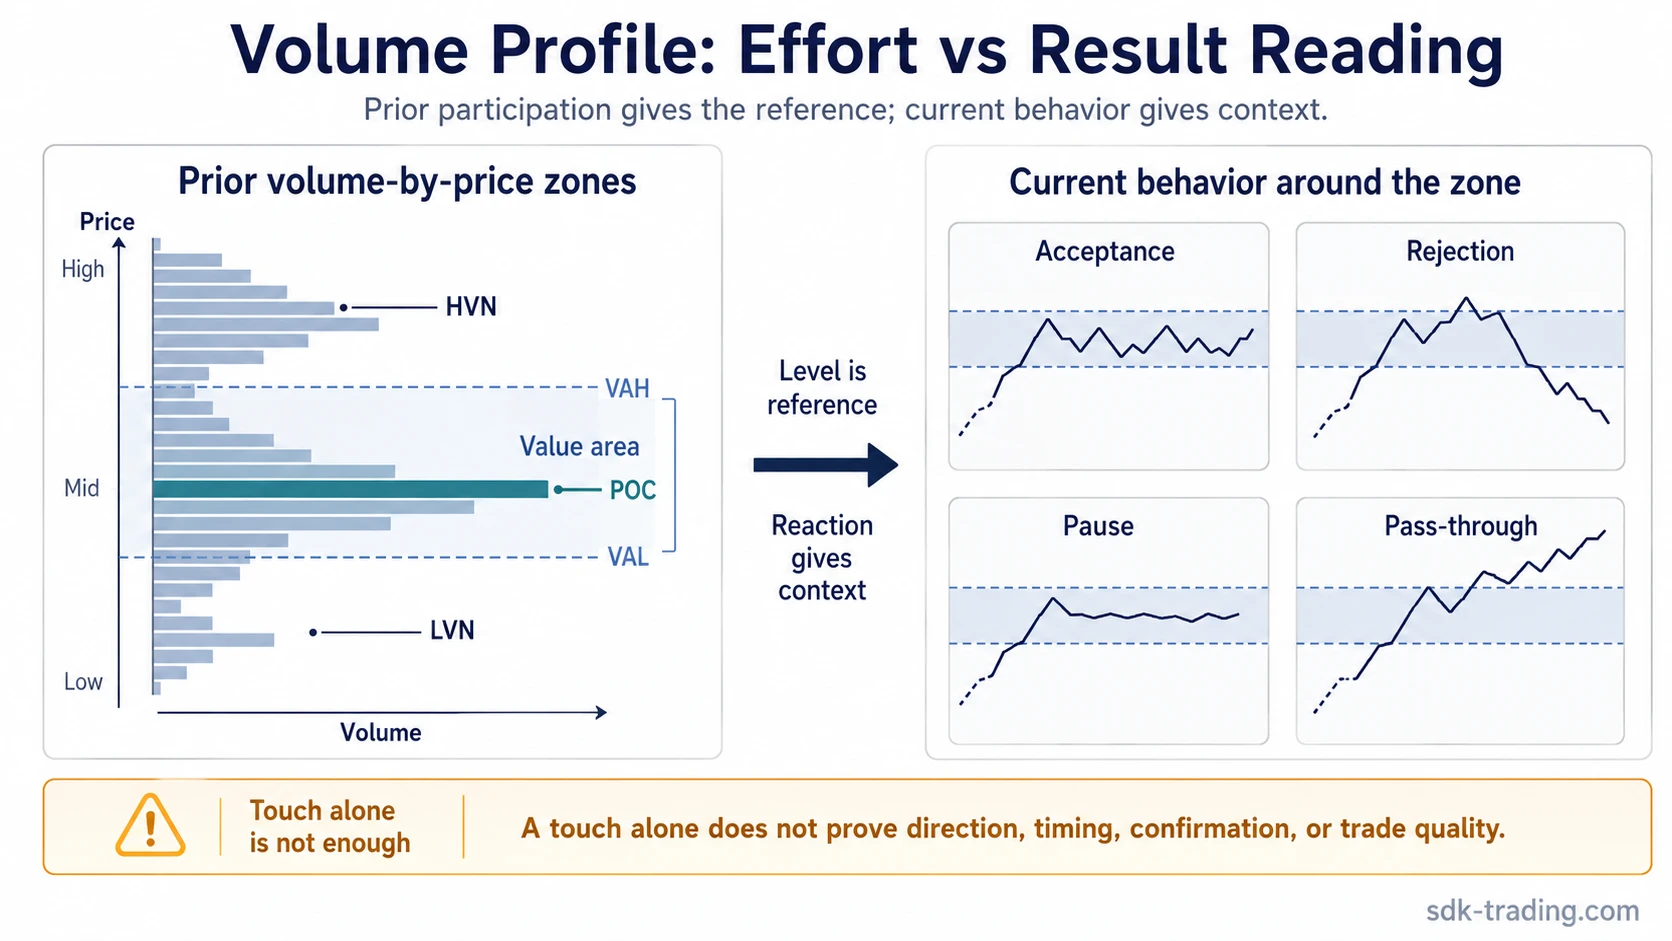
How to Read POC, Value Area, HVN, and LVN
The main Volume Profile components are useful as reference points, not as standalone conclusions. Each one describes a different part of prior participation.
| Component | What it shows | Main limitation |
|---|---|---|
| POC | POC, or point of control, is the price area with the highest traded volume inside the selected profile. | It is not an automatic entry, exit, reversal, or target level. |
| Value area | The value area marks the price region that contains a selected portion of profile volume. | A touch of the value area matters less than whether price accepts, rejects, or fails to hold beyond the boundary. |
| VAH | VAH is the upper boundary of the selected value area. | It should not be treated as automatic resistance. |
| VAL | VAL is the lower boundary of the selected value area. | It should not be treated as automatic support. |
| HVN | A high-volume node is a cluster where prior participation was heavier. | The interpretation depends on whether current price behavior respects, ignores, or rebalances around that cluster. |
| LVN | A low-volume node is an area with thinner prior participation inside the selected profile. | It does not guarantee fast movement or directional continuation. |
Volume Profile Conditions, Misreads, and Safer Interpretations
Volume Profile becomes weaker when the reading stops at the level name. A safer interpretation compares the condition, the tempting misread, and the limitation that still needs to be checked.
| Volume Profile condition | Common misread | Safer interpretation | Limitation / return path |
|---|---|---|---|
| Price returns to POC | POC is treated as an entry or exit level. | POC marks the highest participation area in the selected profile. | Check whether price accepts, rejects, pauses, or passes through the area. |
| Price tests VAH | VAH is treated as automatic resistance. | VAH is a value-area boundary where acceptance or rejection can change the reading. | A brief touch means less than whether price can hold above or return back inside value. |
| Price tests VAL | VAL is treated as automatic support. | VAL is the lower value-area boundary, not a guaranteed reaction point. | The reading improves only after current behavior shows whether lower prices are accepted or rejected. |
| Price moves into an HVN | The HVN is assumed to stop price. | An HVN shows heavier prior participation and possible two-sided interest. | Old participation may matter less if current price keeps accepting beyond the node. |
| Price approaches an LVN | The LVN is assumed to create a fast move. | An LVN shows thinner prior participation in the selected profile. | Thin history does not prove current liquidity, direction, or continuation quality. |
| Profile levels align with a recent price reaction | The level is treated as confirmation by itself. | The alignment can help frame context when price behavior supports the same interpretation. | Separate the level from the reaction; one marks prior activity, the other shows current result. |
How to Use Volume Profile in a Range: PGNY Example
The PGNY chart provides a practical example of how to use Volume Profile as a planning tool rather than as a directional signal. Several selected profiles revealed two broad areas where prior participation had concentrated: an upper participation zone and a lower participation zone.
These volume clusters identified the price areas that required attention. They did not determine whether price would eventually move higher or lower, and they did not convert either boundary into an automatic entry, support level, resistance level, or reversal signal.
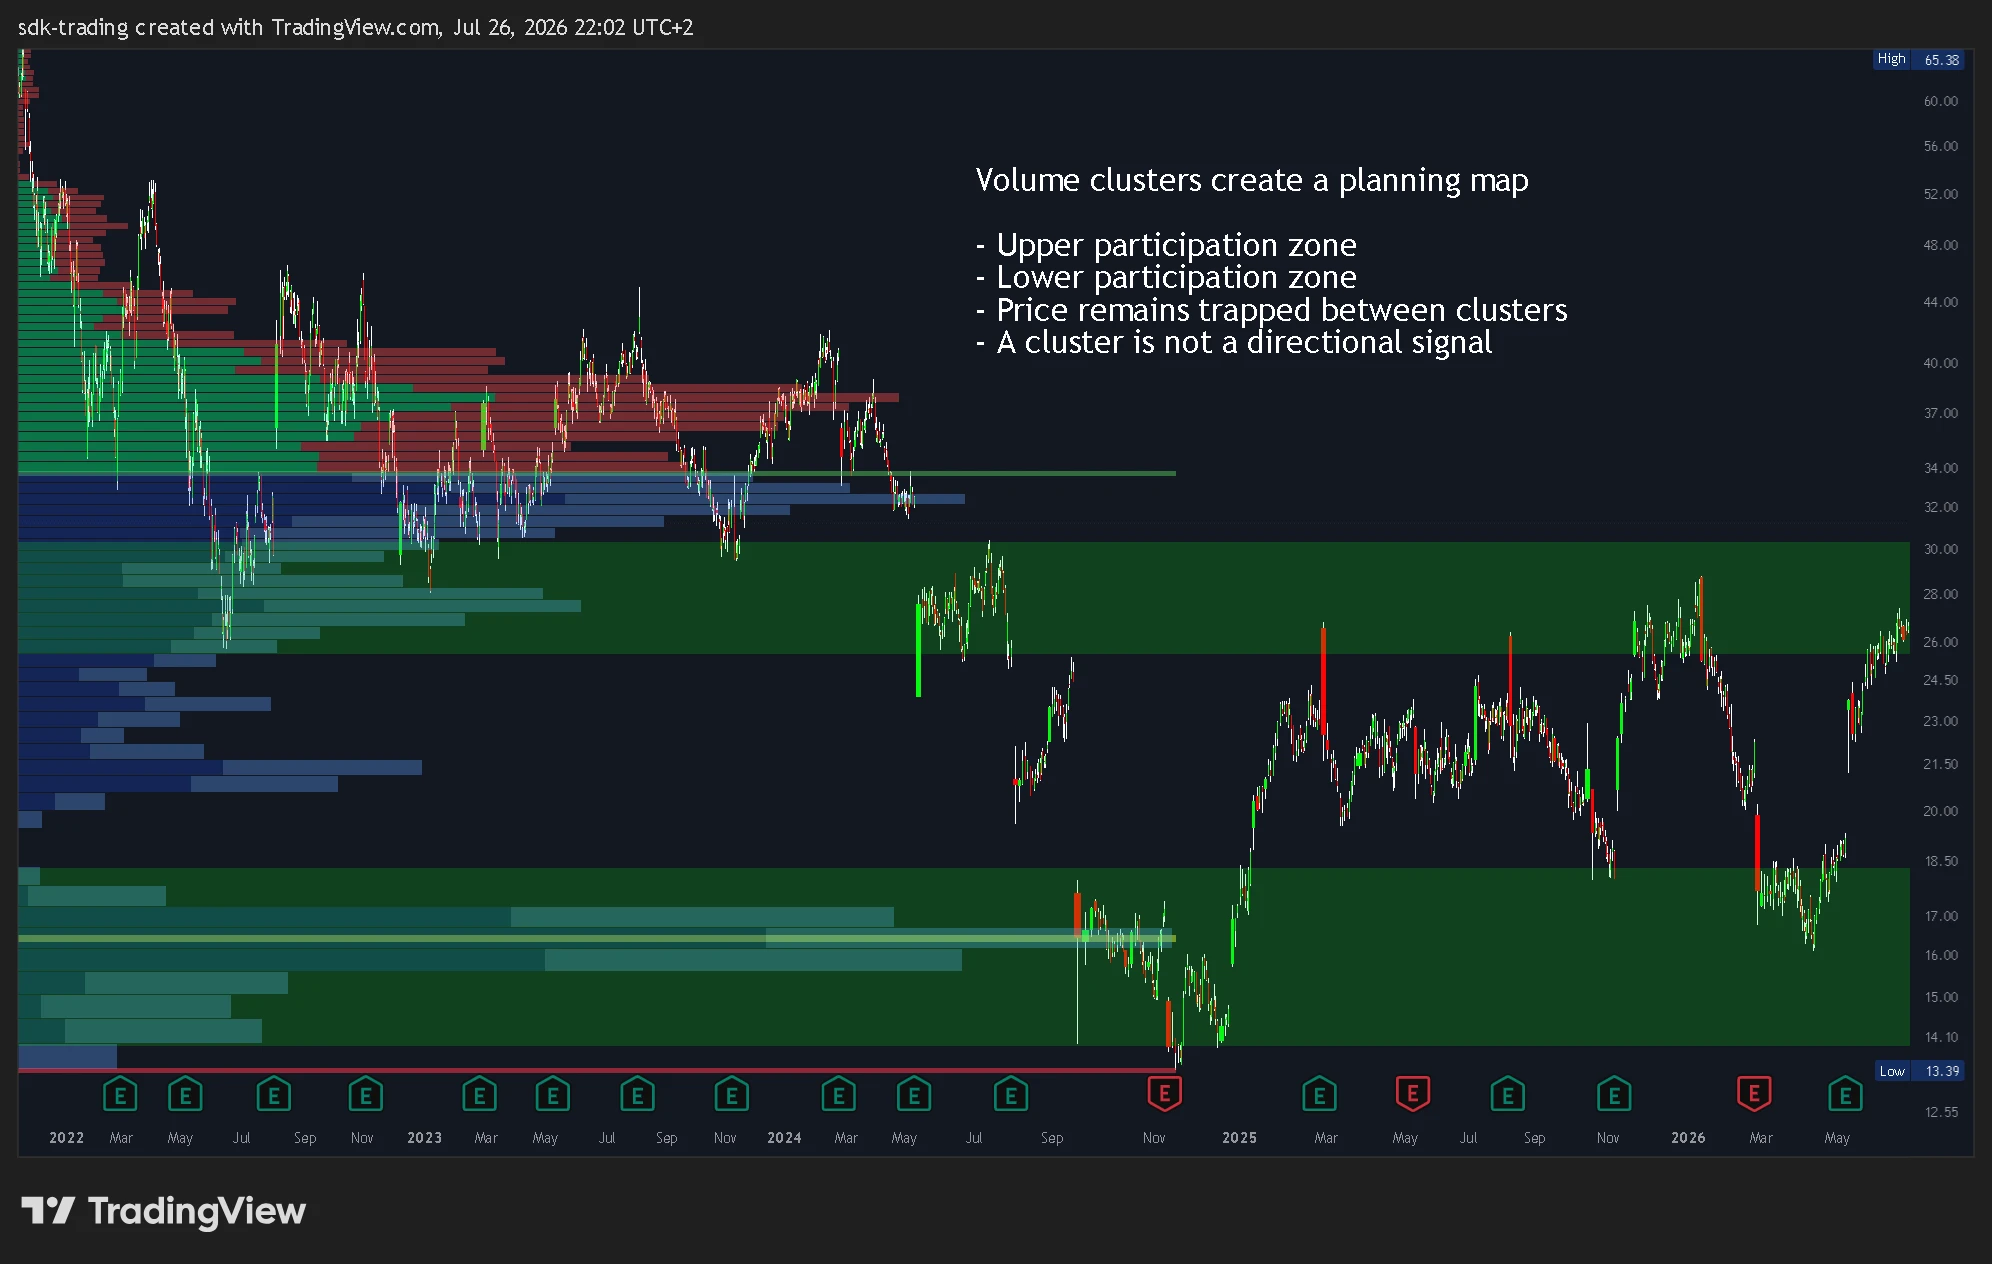
Step 1: Use Volume Clusters to Build the Map
The first chart shows how the selected profiles created a broader planning map. The upper cluster marked an area where price repeatedly struggled to establish sustained trading. The lower cluster marked an area where declines repeatedly produced a reaction and a return towards the active range.
Between those areas, the chart remained structurally unresolved. This created two symmetrical risks:
- Interpreting the upper cluster as guaranteed resistance could fail if price began building acceptance inside or above the zone.
- Interpreting the lower cluster as guaranteed support could fail if price began holding below the area.
The useful information was not that either cluster had to reverse price. The useful information was that these were the areas where the next reaction needed to be evaluated.
Step 2: Compare Acceptance and Rejection
The second chart focuses on price behavior around the two participation zones. Price repeatedly moved into the upper area and then returned towards the range. It also tested the lower area several times and recovered back above it.
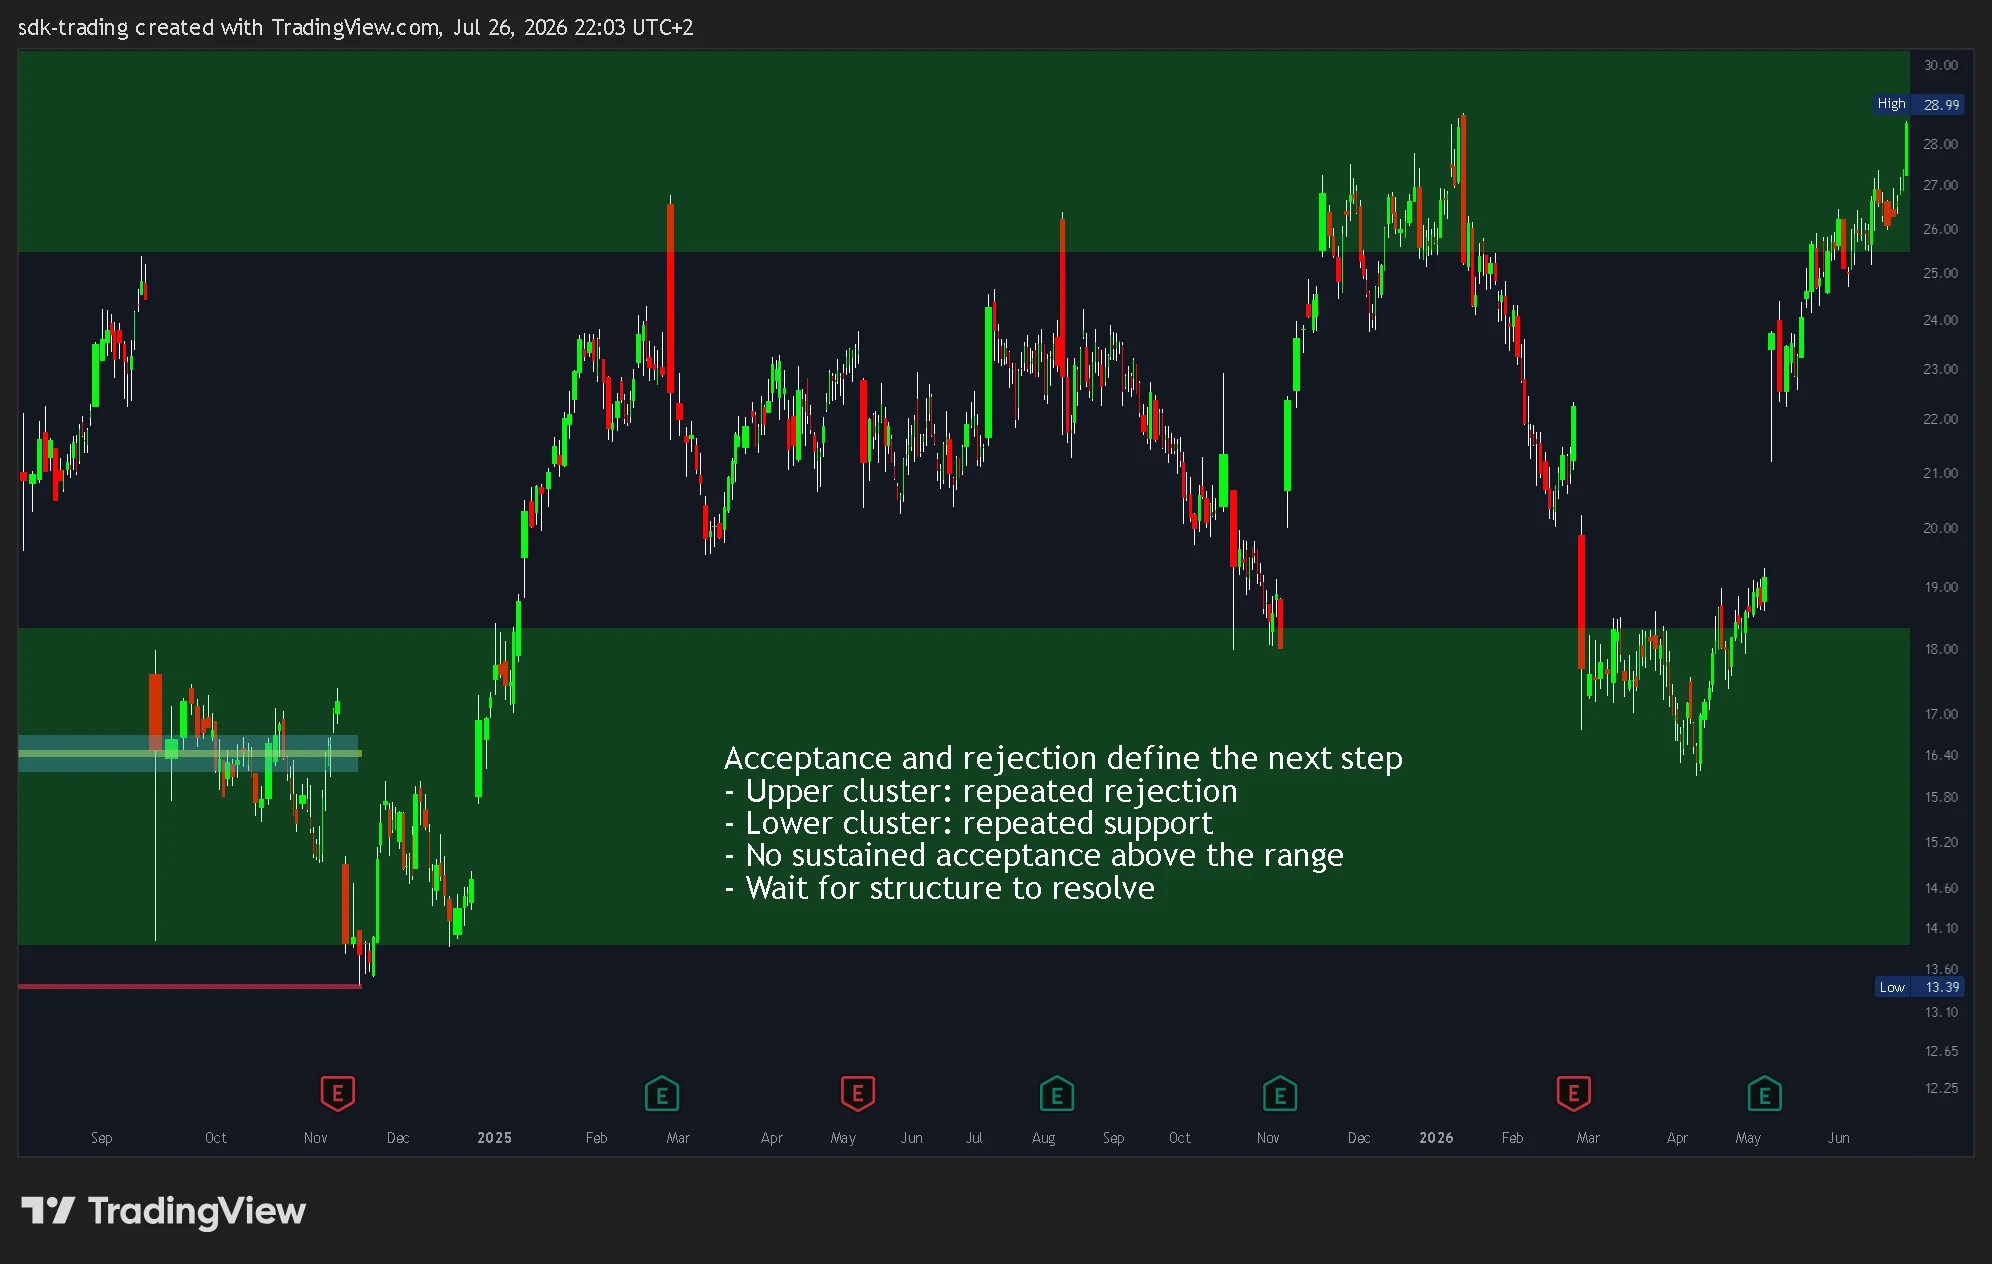
A temporary move into a volume cluster is not the same as acceptance. A stronger acceptance reading would require price to remain beyond the relevant zone, continue trading there, and avoid quickly returning to the earlier range.
Rejection describes the opposite behavior. Price tests an area but cannot remain there, then returns towards the structure from which the test began. Repeated rejection can make a boundary more relevant, but it still does not prove how the next test will resolve.
Step 3: Keep the Reading Conditional
At the time shown on the charts, PGNY had not established a sustained structural resolution beyond the two participation zones. The appropriate Volume Profile reading was therefore conditional:
- Acceptance above the upper zone would change the range structure and require a new assessment.
- Failure to hold the upper zone would keep the rejection scenario active.
- Acceptance below the lower zone would weaken the previous support reading.
- Continued rotation between the zones would leave the market unresolved.
This example shows how to use Volume Profile without overreading it. The profile defines where prior participation clustered. Current price behavior determines whether those historical areas are being accepted, rejected, ignored, or replaced by a new structure.
Common Mistakes When Using Volume Profile
Volume Profile can become misleading when old participation zones are treated as live instructions. The selected profile may no longer match the current auction, the data source may differ from another platform, or a wide range may hide the detail that matters most.
| Mistake | Why it weakens the reading | Safer interpretation |
|---|---|---|
| Using the wrong range | A profile built from a wide historical range can show important older participation, but it may blur the current session or recent swing. | Match the profile type and range to the question being asked. |
| Treating levels as signals | POC, VAH, VAL, HVN, and LVN are reference areas, not complete conclusions. | Read the reaction around the zone before assigning meaning. |
| Ignoring stale profiles | A profile can lose relevance when the market has shifted into a new range, reacted to new information, or built fresh participation somewhere else. | Reassess whether the selected profile still represents the active market context. |
| Confusing volume tools | Volume Profile reads volume by price, while other tools can measure volume change or volume-based momentum over time. | Separate Volume Profile from tools such as the volume oscillator and the Klinger oscillator. |
How to Use Volume Profile Without Overreading It
A disciplined Volume Profile read starts with the selected range, identifies the main participation zones, and then waits for current behavior to give the level context. POC, value area, HVN, and LVN are useful because they organize prior activity. They become risky when they are treated as instructions.
- Choose the profile range deliberately. The selected range defines the data being measured.
- Mark the main participation zones. Identify POC, value area, HVN, and LVN without assigning a trade conclusion.
- Compare price behavior around those zones. Look for acceptance, rejection, pause, or pass-through behavior.
- Check whether the profile still fits the current auction. A stale or overloaded profile can make old volume look more important than it is.
- Keep the reading conditional. A level is context; the result around the level decides whether the context is still useful.
Volume Profile FAQ
Is POC a trading signal?
POC is not a trading signal by itself. It marks the highest participation area in the selected profile. The interpretation depends on how price behaves when it returns to that area.
What is the difference between POC and value area?
POC is the highest-volume price area inside the selected profile. Value area is the broader region that contains a selected share of profile volume, with VAH and VAL marking its upper and lower boundaries.
Can HVN or LVN predict direction?
HVN and LVN do not predict direction by themselves. HVN shows heavier prior participation, while LVN shows thinner prior participation. Current acceptance, rejection, and follow-through shape the interpretation.
Does Volume Profile show current order flow?
Volume Profile shows volume distribution from the selected data range. It can help frame prior participation zones, but it should not be treated as a complete live order-flow view.