Market breadth indicators measure how widely participation is distributed across a market, index, or stock universe. The useful filter is whether the reading describes advancing and declining issues, new highs and new lows, option sentiment, thrust behavior, or the share of stocks holding above a moving-average threshold.
Definition: Market breadth indicators are technical market-internal tools that compare participation across many securities rather than measuring only the price of one index or instrument. They help classify whether market movement is broad, narrow, improving, weakening, or concentrated in fewer components.
In market analysis, breadth describes participation beneath the surface of an index move. A headline index can rise even when fewer components are participating, and it can weaken even while internal participation begins to stabilize.
Key Points
- Market breadth indicators read participation across a group of securities, not only the price movement of one chart.
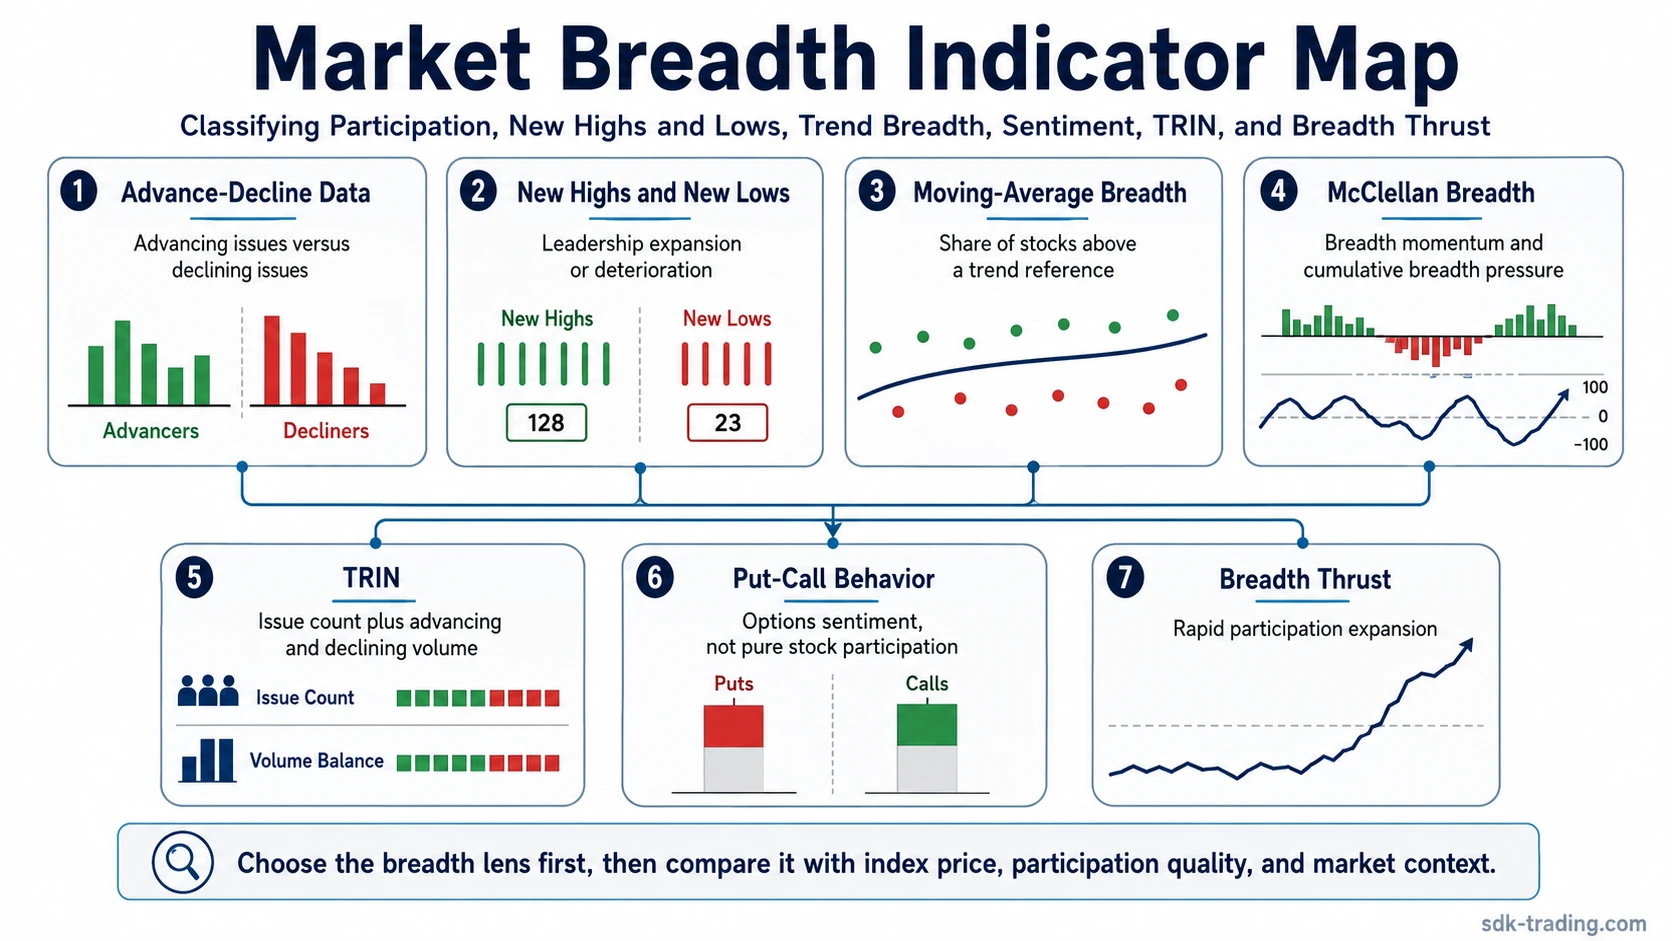
- Different breadth tools measure different internals: advancing issues, new highs and lows, option positioning, thrust behavior, or moving-average participation.
- A strong index can have weak breadth if only a small group of components is carrying the move.
- Breadth readings become more useful when the indicator type matches the question: participation, concentration, sentiment, expansion, or deterioration.
Market Breadth Indicator Choice Map
The fastest way to choose a breadth indicator is to define the participation question first. Some tools count advancing and declining issues, some track new highs and new lows, some measure option behavior, and others show how many stocks remain above a moving-average reference.
| Reader question | Best route | Participation boundary |
|---|---|---|
| Are more stocks advancing or declining over time? | Advance Decline Line | Use for cumulative participation across advancing and declining issues. |
| How strong is the balance between advancing and declining stocks? | Advance Decline Ratio | Use for ratio-based participation pressure rather than cumulative breadth. |
| How many stocks are still showing bullish point-and-figure participation? | Bullish Percent Index | Use for the percentage of stocks with bullish point-and-figure signals inside a group. |
| Are new highs expanding faster than new lows? | High Low Index | Use for new-high and new-low participation balance. |
| Is short-term breadth momentum expanding or contracting? | McClellan Oscillator | Use for breadth momentum based on advancing and declining issues. |
| How is breadth momentum accumulating over a longer sequence? | McClellan Summation Index | Use for cumulative breadth momentum rather than short-term breadth swings. |
| Are more securities making fresh highs or fresh lows? | New Highs New Lows | Use for leadership expansion, deterioration, and index participation quality. |
| How many stocks remain above a long-term trend reference? | Percent of Stocks Above 200-Day Moving Average | Use for broad trend participation across a market universe. |
| What does options positioning suggest about crowd sentiment? | Put Call Ratio | Use for options-based sentiment, not direct stock participation alone. |
| How do advancing volume, declining volume, and issue count interact? | TRIN indicator | Use for breadth and volume pressure in one market-internal reading. |
| Has participation expanded sharply enough to form a breadth thrust? | Zweig Breadth Thrust | Use for rapid participation expansion across advancing stocks. |
Why Breadth Can Disagree With an Index
Breadth disagreement usually appears when the index level hides what is happening inside the market. An index can rise while fewer components participate, or it can weaken while internal participation starts to stabilize.
The reading depends on the breadth lens. Advance-decline tools focus on participation count, new-high and new-low tools focus on leadership quality, moving-average breadth focuses on trend participation, and options-based readings such as put-call behavior reflect sentiment pressure rather than pure stock-count participation.
Breadth reading check: Identify the participation source first: advancing issues, declining issues, new highs, new lows, option positioning, advancing volume, declining volume, or moving-average participation. The signal is weaker when the index move and the chosen breadth lens are answering different questions.
Market Breadth Scope Boundaries
Market breadth is not the same as a trend indicator, oscillator category, volume indicator, or support-resistance tool. It describes participation across a group of securities. That makes it useful when the headline index and the average component are not telling the same story.
A narrow index advance can still look strong on the surface if a small group of large components is rising. Breadth tools help separate that surface strength from broader participation. The opposite can also happen: an index may look flat while more components begin improving beneath the surface.
| Market question | Breadth lens | Common misread |
|---|---|---|
| Is participation expanding? | Advance-decline and thrust readings. | Assuming index price alone proves broad participation. |
| Is leadership improving or weakening? | New highs, new lows, and high-low measures. | Ignoring whether fewer stocks are making fresh highs. |
| Are most stocks above a trend reference? | Moving-average breadth. | Using the index moving average as a substitute for component participation. |
| Is sentiment pressure extreme? | Put-call behavior. | Treating options sentiment as the same thing as stock participation breadth. |
How to Read Market Breadth Indicators
Start with the market universe being measured. A breadth reading for one index, sector, exchange, or watchlist may not describe another universe. The same indicator can carry a different meaning if the underlying group changes.
Then match the indicator to the participation question. Advance-decline data helps with participation count, high-low data helps with leadership quality, moving-average breadth helps with trend participation, and put-call data helps with sentiment pressure. A cleaner breadth reading appears when the index move and the internal participation measure point to the same market condition.
When Breadth Readings Need Caution
Breadth readings can become misleading when the indicator universe is too narrow, the index is dominated by a few large components, or the chosen breadth measure answers a different question from the one being asked.
A put-call ratio reading, for example, is not the same as advance-decline participation. TRIN combines issue count with volume pressure. Moving-average breadth shows how many components remain above a trend reference. These tools can all belong to the breadth family, but they do not measure the same internal condition.