The High-Low Index is a market breadth indicator that measures participation by comparing stocks making new 52-week highs with stocks making new 52-week lows. It is a smoothed, normalized percentage of new-high participation, not the raw New Highs New Lows count itself.
Definition: The High-Low Index shows the percentage relationship between new 52-week highs and the combined total of new 52-week highs and new 52-week lows, usually smoothed with a 10-day simple moving average.
Key Points
- The High-Low Index belongs to the market breadth family because it measures how many stocks participate in upside or downside extremes.
- The usual calculation starts with Record High Percent, then smooths that percentage with a moving average.
- Readings above 70, below 30, and around 50 are participation zones, not automatic trading instructions.
- The selected universe matters because exchange-level and index-level readings can describe different participation backdrops.
What Is the High-Low Index?
The High-Low Index converts new 52-week high and new 52-week low data into a 0 to 100 breadth reading. A high reading means a larger share of the new-high/new-low universe is reaching new highs. A low reading means new lows are dominating that same universe.
The indicator focuses on participation at extremes. It does not measure price trend directly, and it does not measure the size of price moves. A market index can rise while the High-Low Index weakens if fewer components are reaching new highs beneath the surface.
The indicator works best as a breadth-condition reading rather than a direct price-trend measure. It can show whether upside or downside movement is broadly supported, but it still needs price structure, trend behavior, volatility, and the chosen market universe around it.
High-Low Index Classification: Where It Fits in Market Breadth
The High-Low Index is best classified as a smoothed participation breadth indicator. Its input comes from 52-week extremes, its output is a percentage, and its interpretation focuses on whether participation is broadening, narrowing, or flipping around the midpoint.
| Classification point | High-Low Index role | Important boundary |
|---|---|---|
| Indicator family | Market breadth | Measures participation across a universe, not one chart alone |
| Main input | New 52-week highs and new 52-week lows | Depends on the selected exchange, index, or stock universe |
| Output type | 0 to 100 percentage reading | Normalizes raw high-low data into a comparable scale |
| Common smoothing | 10-day simple moving average | Reduces day-to-day noise but can add lag |
| Typical use | Breadth condition and participation context | Does not create automatic action levels |
How the High-Low Index Is Calculated
The common calculation begins with Record High Percent. This compares the number of stocks making new 52-week highs with the combined number of stocks making new 52-week highs and new 52-week lows.
Common formula:
Record High Percent = New Highs / (New Highs + New Lows) x 100.
The High-Low Index is commonly shown as a 10-day simple moving average of that Record High Percent reading.
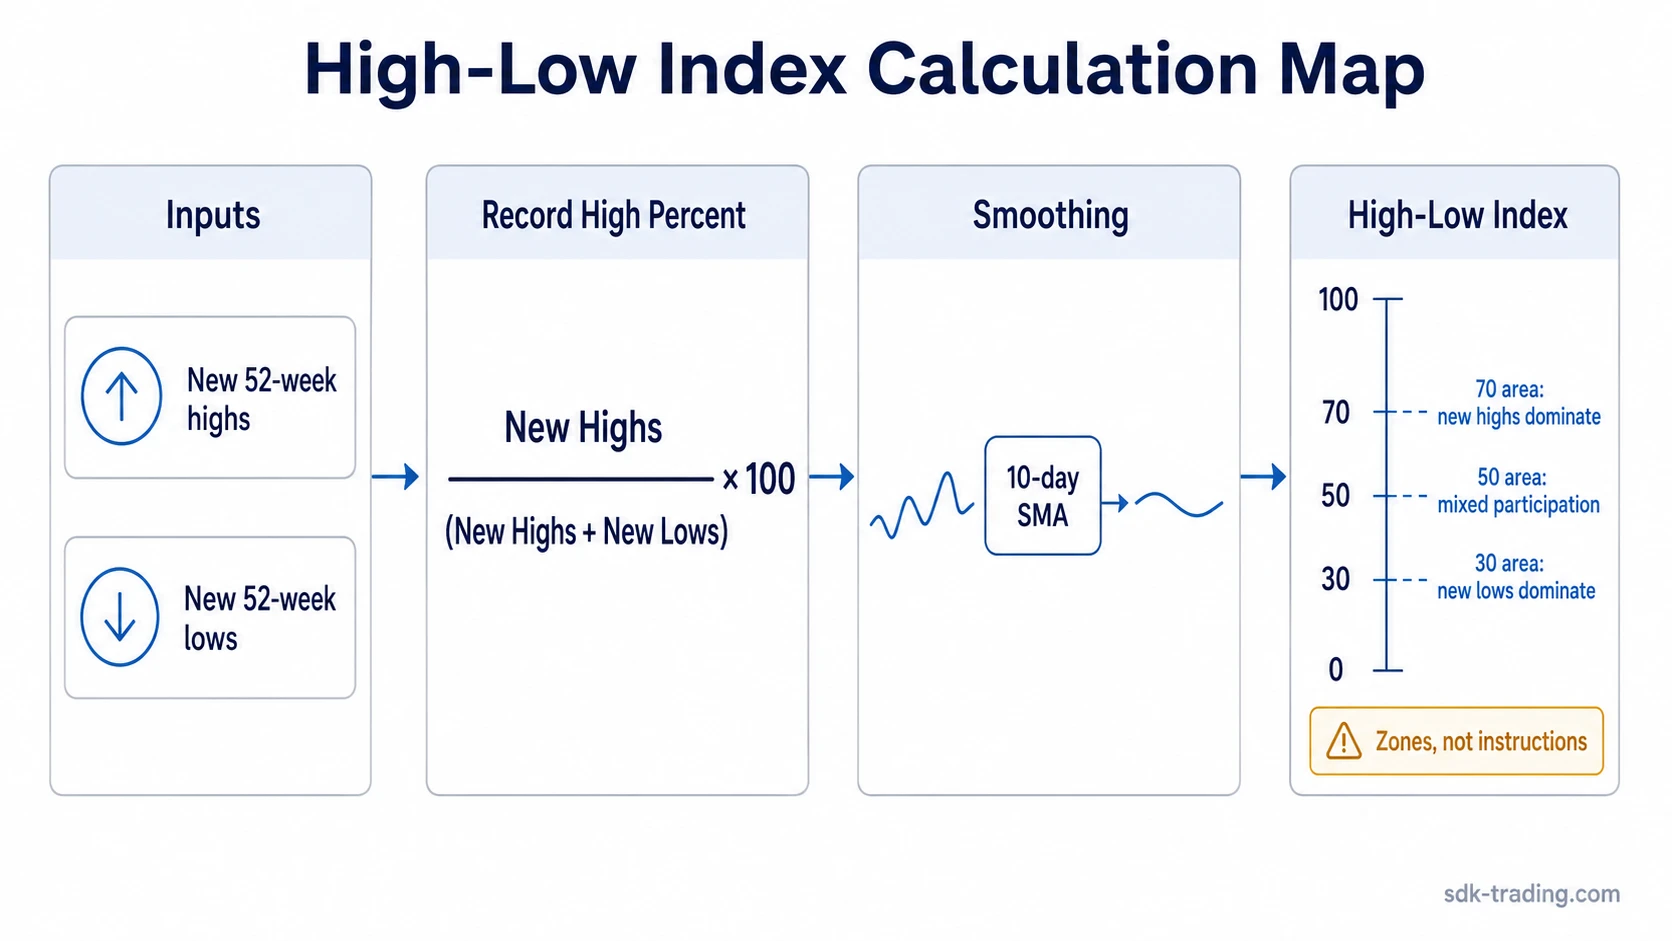
A reading near 100 means new highs dominate the high-low universe. A reading near 0 means new lows dominate. A reading around 50 means new highs and new lows are more balanced.
Different data vendors may label or smooth the indicator differently, so the calculation method should be checked when comparing charts from separate platforms. The common 10-day smoothing can reduce single-day noise, but it can also make the index react later than raw daily new-high/new-low data.
How to Read High-Low Index Levels
High-Low Index levels are usually read as breadth zones. The zones help describe participation, but they should not be treated as fixed instructions. The same reading can mean something different depending on price trend, market regime, volatility, and whether the level is stable or only a brief cross.
| Zone | Typical breadth reading | Safer interpretation | Common mistake |
|---|---|---|---|
| Above 70 | New highs dominate new lows | Upside participation is broad if the reading persists | Treating the zone as a mechanical bullish instruction |
| Around 50 | New highs and new lows are more balanced | Breadth is mixed, especially if the reading keeps flipping | Overreading every small cross above or below the midpoint |
| Below 30 | New lows dominate new highs | Downside participation is broad if weakness persists | Treating the zone as a mechanical bearish instruction |
The 50 level is often the easiest area to overread. A brief move above 50 can fade quickly if participation does not continue to broaden. A brief move below 50 can also reverse if new lows fail to expand. Stability matters more than one isolated threshold touch.
High-Low Index vs New Highs New Lows
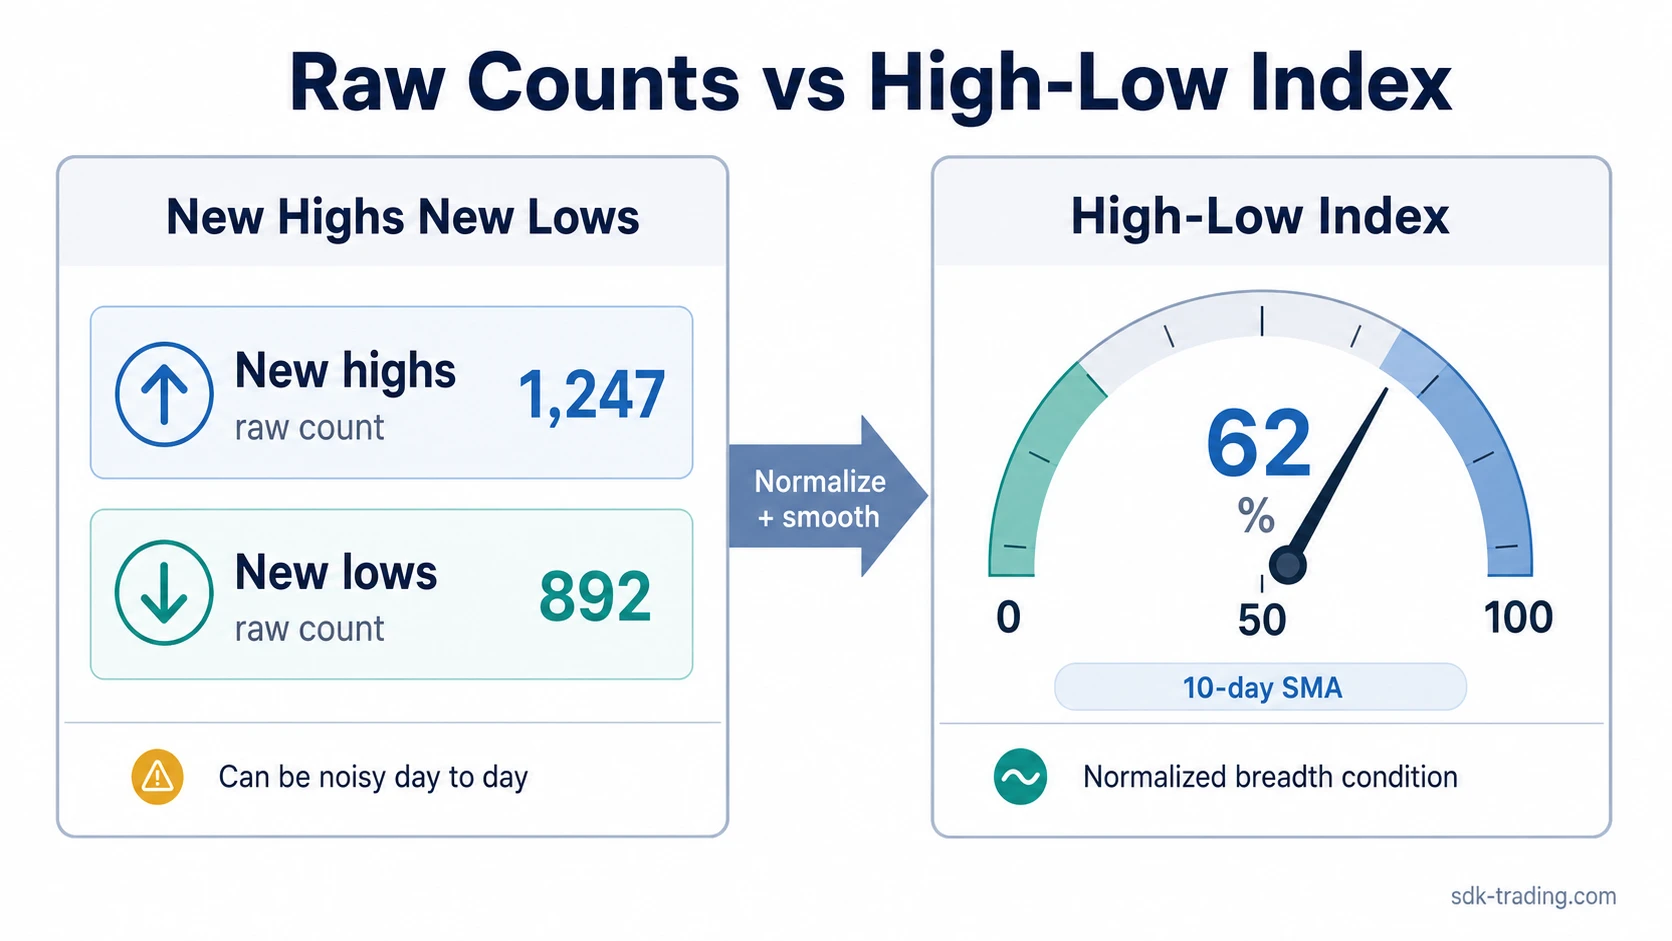
New Highs New Lows is the raw breadth input. It counts stocks reaching new 52-week highs and stocks reaching new 52-week lows. The High-Low Index converts that relationship into a percentage and commonly smooths it.
Raw counts can be noisy when the number of new highs and new lows changes quickly from day to day. The High-Low Index reduces some of that noise, but the smoothing also means it can react later than the raw data.
| Feature | New Highs New Lows | High-Low Index |
|---|---|---|
| Main form | Raw count or difference | Normalized percentage |
| Input | New 52-week highs and new 52-week lows | Same high-low data, converted into Record High Percent |
| Smoothing | Often viewed directly or with separate smoothing | Commonly shown as a 10-day simple moving average |
| Best use | Raw participation pressure | Smoothed breadth condition |
| Main risk | Day-to-day noise | Lag and threshold overreading |
What Makes a High-Low Index Reading Stronger or Weaker
A stronger High-Low Index reading has persistence, breadth support, and agreement with the market universe being analyzed. A single high reading carries less weight when it appears only briefly or conflicts with narrowing participation elsewhere.
| Reading boundary | What to check | Stronger reading | Weaker or failed reading |
|---|---|---|---|
| Input quality | New 52-week highs and lows | New highs expand while new lows stay limited | Index price rises but new highs do not broaden |
| Formula output | Record High Percent | The percentage improves with clear participation | The percentage improves only because new lows briefly contract |
| Smoothing | 10-day moving average behavior | The smoothed line holds above the relevant zone | The line repeatedly whipsaws around 50 |
| Threshold zone | 30, 50, and 70 areas | The zone is held long enough to show breadth persistence | The threshold is touched once and immediately lost |
| Universe fit | Exchange or index coverage | The chosen universe matches the market being judged | A broad exchange reading is applied to a narrow index without adjustment |
| Failure condition | Price and participation together | Price strength is accompanied by expanding new highs | Price improves while fewer stocks reach new highs |
Price can keep advancing even while the High-Low Index weakens. That does not automatically reverse the market. It signals that participation is narrowing, which makes the breadth condition less supportive than the price chart alone might suggest.
Common High-Low Index Misreads
A common misread is treating 70, 50, and 30 as mechanical levels. They are better understood as zones that describe participation. The interpretation improves when the reading is compared with persistence, direction, raw new-high/new-low behavior, and the relevant universe.
Common mistake: A move above 70 is sometimes read as a complete bullish condition by itself. A safer reading asks whether new highs are still expanding, whether the level is holding, and whether the price index is being supported by broad participation rather than a smaller group of leaders.
Universe dependency can also distort the reading. A High-Low Index based on one exchange can describe a different participation backdrop than a reading based on a narrower index. The indicator should be matched to the market being interpreted.
Lag is part of the design. Because the common version uses 52-week extremes and smoothing, it can confirm participation after the earliest shift has already started. That lag can reduce noise, but it can also delay recognition of a fast breadth reversal.
High-Low Index Example in Context
A market index advances into a prior high area while the High-Low Index slips from above 70 toward the midpoint. The price move still shows strength, but fewer components are reaching new 52-week highs. The breadth reading becomes less supportive if the index pushes higher while the High-Low Index keeps falling or repeatedly fails near 50.
The same condition remains unresolved if new highs begin expanding again and the smoothed reading stabilizes. A single threshold touch matters less than whether new-high participation keeps expanding, stalls, or fades while price continues moving.
Related Breadth Indicators
The High-Low Index belongs to a broader group of breadth tools, but each indicator uses a different input. Bullish Percent Index measures the percentage of components on Point and Figure buy signals, so it is also a percentage breadth indicator but not a new-high/new-low measure.
The McClellan Summation Index uses accumulated McClellan Oscillator values, which makes it a cumulative breadth momentum tool rather than a smoothed percentage of new 52-week highs and lows.
The clean boundary is the input source: the High-Low Index reads new-high/new-low participation, Bullish Percent Index reads Point and Figure signal participation, and McClellan Summation Index reads cumulative breadth momentum.
FAQ
What does the High-Low Index measure?
The High-Low Index measures the percentage relationship between stocks making new 52-week highs and the combined total of stocks making new 52-week highs and new 52-week lows.
What is the common High-Low Index formula?
The common starting point is Record High Percent: New Highs divided by New Highs plus New Lows, multiplied by 100. The High-Low Index is commonly shown as a 10-day simple moving average of that percentage.
Is a High-Low Index reading above 70 a trading signal?
A reading above 70 can show broad upside participation, but it is not an automatic instruction. Persistence, price context, raw high-low behavior, and the selected universe still matter.
Why can the High-Low Index lag price movement?
The indicator can lag because it uses 52-week extremes and is commonly smoothed with a moving average. Smoothing can reduce noise, but it can also delay recognition of fast breadth changes.