The bullish percent index is a market breadth indicator that measures the percentage of stocks in a defined index, sector, or group that are on Point & Figure buy signals. BPI describes participation breadth: how many components are in a bullish technical state, not whether the index price itself is trending cleanly.
Definition: The bullish percent index, often shortened to BPI, is calculated by dividing the number of components on Point & Figure buy signals by the total number of components in the selected universe, then expressing the result as a percentage from 0 to 100.
A BPI reading is binary at the component level. Each stock is counted as either on a Point & Figure buy signal or not. That makes BPI different from price momentum, relative strength, or moving-average position, because it measures how broad the bullish state is across the group rather than how far one index has moved.
Key Points
- BPI measures the percentage of index, sector, or group components on Point & Figure buy signals.
- The indicator ranges from 0 to 100 because each component has a binary included-or-not-included state.
- Levels near 30, 50, and 70 are interpretive zones, not automatic action levels.
- Direction, reversal behavior, component universe, and price-breadth alignment change the quality of the reading.
What the Bullish Percent Index Measures
BPI measures participation inside a defined market group. A rising reading means more components are shifting into a bullish Point & Figure state. A falling reading means fewer components still meet that condition.
The selected universe matters. A BPI for the S&P 500 describes participation inside that index. A sector BPI describes participation inside that sector. A small group can move sharply because a few components may change the percentage more than they would in a broad index.
The indicator belongs to market breadth because it looks beneath the index price. An index can rise while participation narrows, or it can pause while more components quietly improve. BPI helps separate index-level movement from component-level participation.
How the Bullish Percent Index Is Calculated
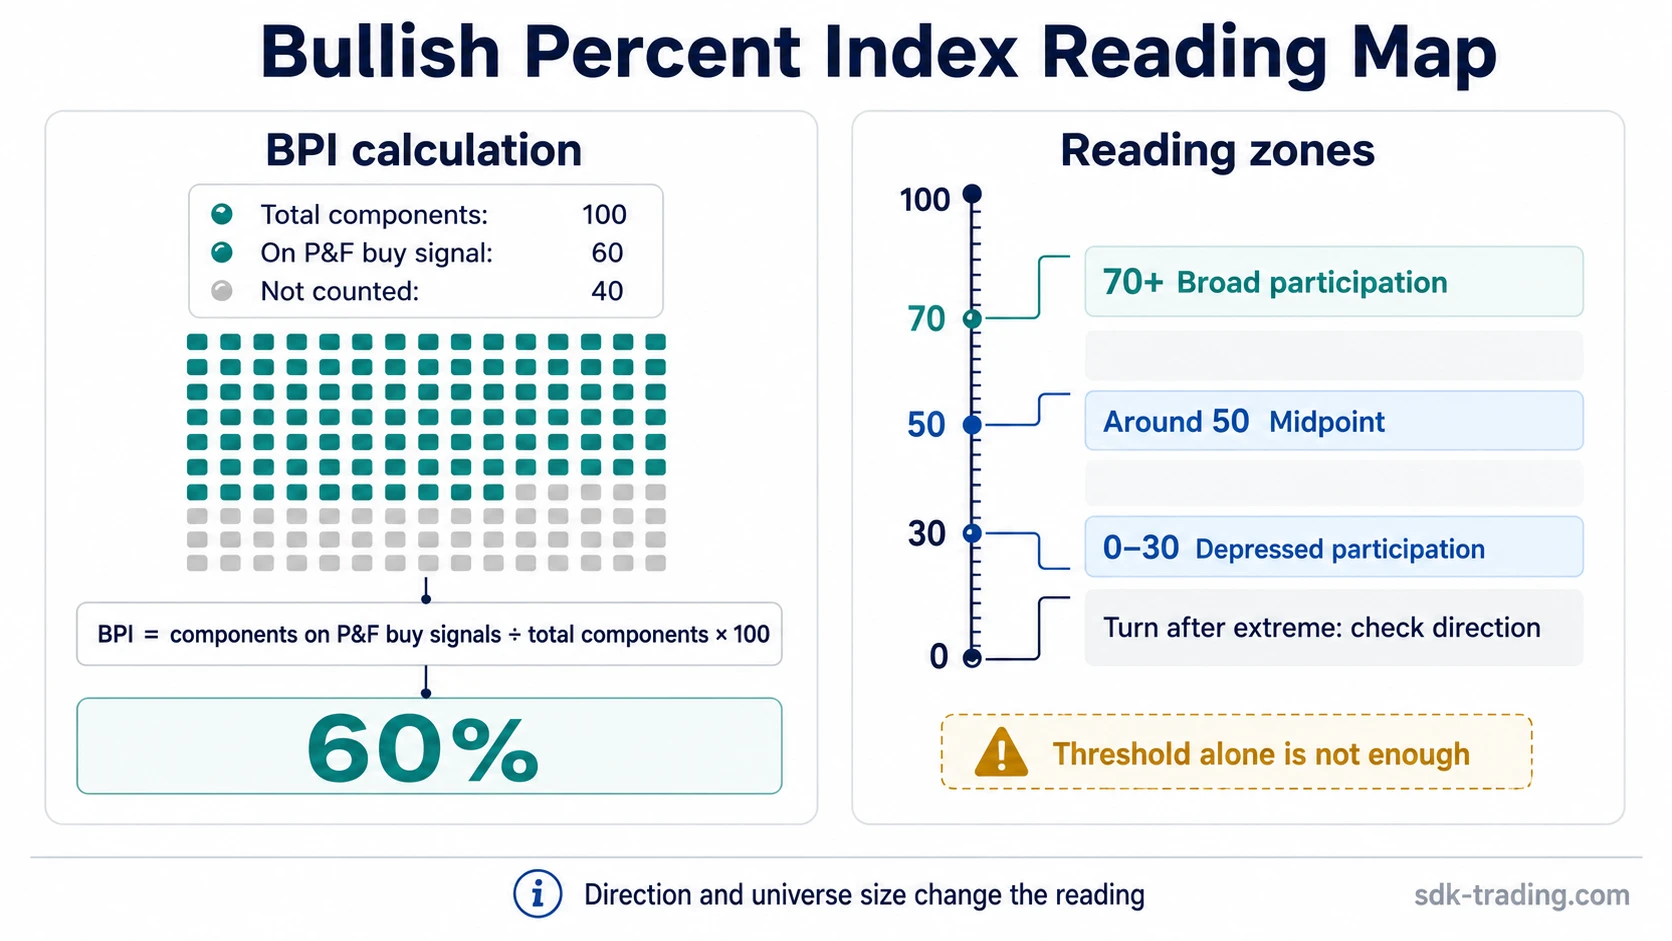
The calculation is simple, but the input is specific. BPI counts how many components are on Point & Figure buy signals, divides that count by the total number of components in the chosen index or group, and multiplies the result by 100.
| Calculation part | What it means | Why it matters |
|---|---|---|
| Numerator | Components on Point & Figure buy signals | Shows how many stocks currently qualify for inclusion in the bullish count. |
| Denominator | Total components in the selected index or group | Defines the universe being measured. |
| Percentage result | Numerator divided by denominator, multiplied by 100 | Creates a 0 to 100 breadth reading. |
A reading of 60 means 60% of the selected components are on Point & Figure buy signals. It does not mean the index price has risen 60%, and it does not measure the strength of each individual stock. It only reports the share of components that meet the binary Point & Figure condition.
Point & Figure note: BPI depends on Point & Figure state, not on ordinary green or red candles. The useful point is the buy-signal classification of each component, not a full Point & Figure taxonomy.
How to Read 30, 50, and 70 Levels
The 30, 50, and 70 areas are common reference zones. They help frame breadth condition, but threshold contact alone is a weak reading. A more useful interpretation compares the level, direction, recent reversal behavior, and whether price behavior agrees with participation.
| BPI area | Basic breadth condition | Stronger interpretation | Common misread |
|---|---|---|---|
| Below 30 | Participation is depressed. | The reading improves if breadth turns up and more components begin joining the bullish count. | Treating a low reading as an automatic bullish turn. |
| Around 50 | Participation is near the midpoint of the group. | The slope and direction can show whether participation is expanding or contracting. | Reading the midpoint as neutral without checking recent change. |
| Above 70 | Participation is broad and elevated. | The reading remains healthier if participation stays broad without immediate deterioration. | Treating a high reading as an automatic bearish condition. |
| Reversal from an extreme | The percentage has turned after reaching a high or low zone. | The reading gains meaning when the turn is supported by broader participation behavior. | Reacting to the first tick away from an extreme before the participation shift is clear. |
The threshold is only the starting point. A 50 reading marks the participation midpoint, while the direction before and after that area shows whether the group is broadening, stalling, or losing participation.
BPI Versus Other Breadth Indicators
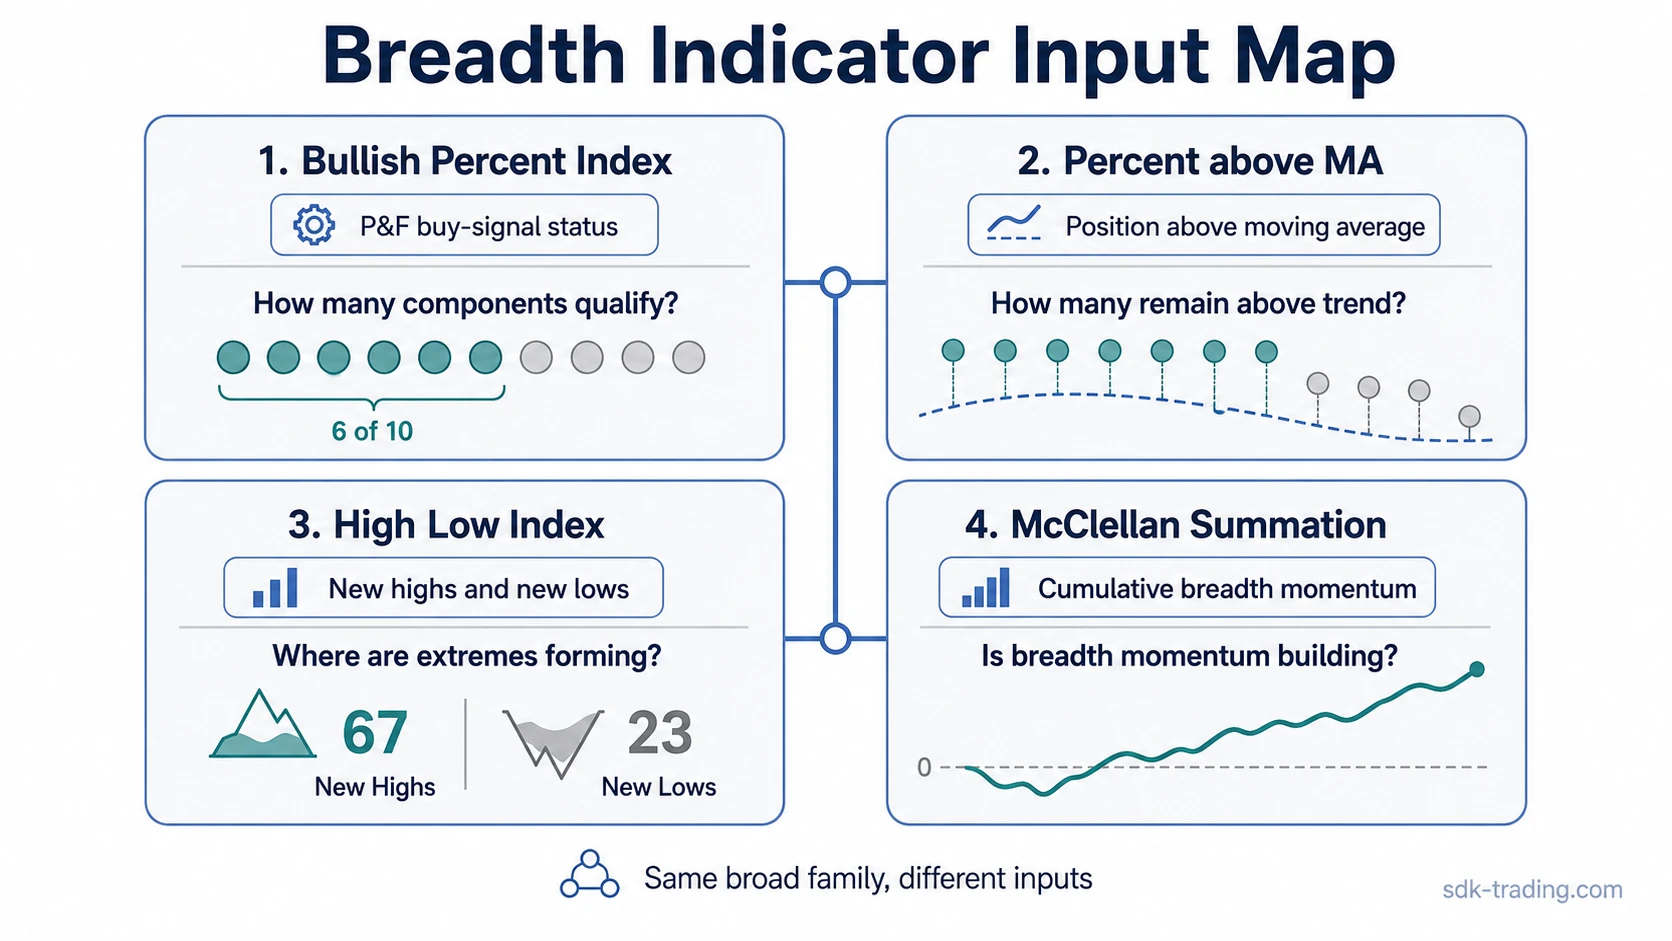
BPI is easy to confuse with other percent-based breadth measures because the output is also a percentage. The input is different. Percent of Stocks Above 200 Day Moving Average measures whether components are above a long moving average, while BPI measures whether components are on Point & Figure buy signals.
The High Low Index uses new highs and new lows, so it focuses on the condition of price extremes rather than the binary Point & Figure state of the whole component universe.
The McClellan Summation Index is a cumulative breadth momentum measure. BPI is not cumulative in the same way; it reports the current percentage of components that meet the Point & Figure condition.
| Indicator | Main input | Core question |
|---|---|---|
| Bullish Percent Index | Components on Point & Figure buy signals | How broad is the bullish technical state inside the selected universe? |
| Percent above 200-day moving average | Components above a long moving average | How many stocks remain above a long-term trend reference? |
| Advance-decline ratio | Advancing issues versus declining issues | How broad is the current session or period movement? |
| High Low Index | New highs and new lows | Are more components making strength or weakness extremes? |
| McClellan Summation Index | Cumulative breadth momentum | Is breadth momentum expanding or fading over time? |
Clean, Weak, and Invalid BPI Readings
A clean BPI reading has more than a threshold label. It combines the level, the direction of the indicator, the behavior after a turn, and the quality of participation across the selected group.
| Reading quality | What the BPI behavior looks like | What still needs caution |
|---|---|---|
| Clean | BPI turns up from depressed breadth and more components join the bullish count. | The index price should not be rejecting the same improvement immediately. |
| Weak | BPI touches a threshold but participation does not continue expanding. | The threshold may describe condition, not a durable participation shift. |
| Invalid or misread | 30 or 70 is treated as enough evidence by itself. | The reading ignores direction, universe size, component behavior, and price-breadth agreement. |
Common misread: A high BPI reading can remain high while participation stays broad. A low BPI reading can remain low while participation remains damaged. The level describes breadth condition; the shift in participation determines whether the reading is improving, weakening, or unresolved.
Simple Bullish Percent Index Example
A broad index has spent several weeks with weak participation, and BPI sits below 30. A few components moving back onto Point & Figure buy signals only shows the first change in condition. The reading becomes more useful when participation broadens across the group and the index stops rejecting recovery attempts immediately.
The same low BPI area remains unresolved if only a small part of the group improves while participation keeps fading elsewhere. In that case, the low threshold identifies depressed breadth, but it does not show that the participation turn has become durable.
Limitations of the Bullish Percent Index
BPI is useful because it compresses many component-level states into one breadth reading. That compression also creates limitations.
- Extended readings can persist: BPI can stay above 70 or below 30 longer than a simple threshold model would imply.
- Reversals can appear late: The indicator may turn after price has already moved because component states need time to change.
- Smaller universes can be jumpier: A few component changes can move the percentage more sharply in a narrow group.
- Universe changes matter: Index membership or component changes can affect comparisons across long periods.
- Price and breadth can conflict: An index may rise while BPI weakens, or pause while BPI improves.
A disciplined interpretation treats BPI as a participation-quality measure. It can improve a breadth read, but it should not replace the separate work of understanding trend, structure, volatility, and the behavior of the selected universe.
FAQ
What does the bullish percent index measure?
The bullish percent index measures the percentage of components in a selected index or group that are on Point & Figure buy signals.
How is BPI calculated?
BPI is calculated by dividing the number of components on Point & Figure buy signals by the total number of components in the selected universe, then multiplying by 100.
What do 30 and 70 mean on the bullish percent index?
Readings near 30 usually describe depressed participation, while readings near 70 describe broad participation. The direction and behavior after reaching those areas matter more than the threshold touch alone.
Is BPI the same as the percent of stocks above a moving average?
No. BPI uses Point & Figure buy-signal status, while percent-above-moving-average measures whether components are above a selected moving average.