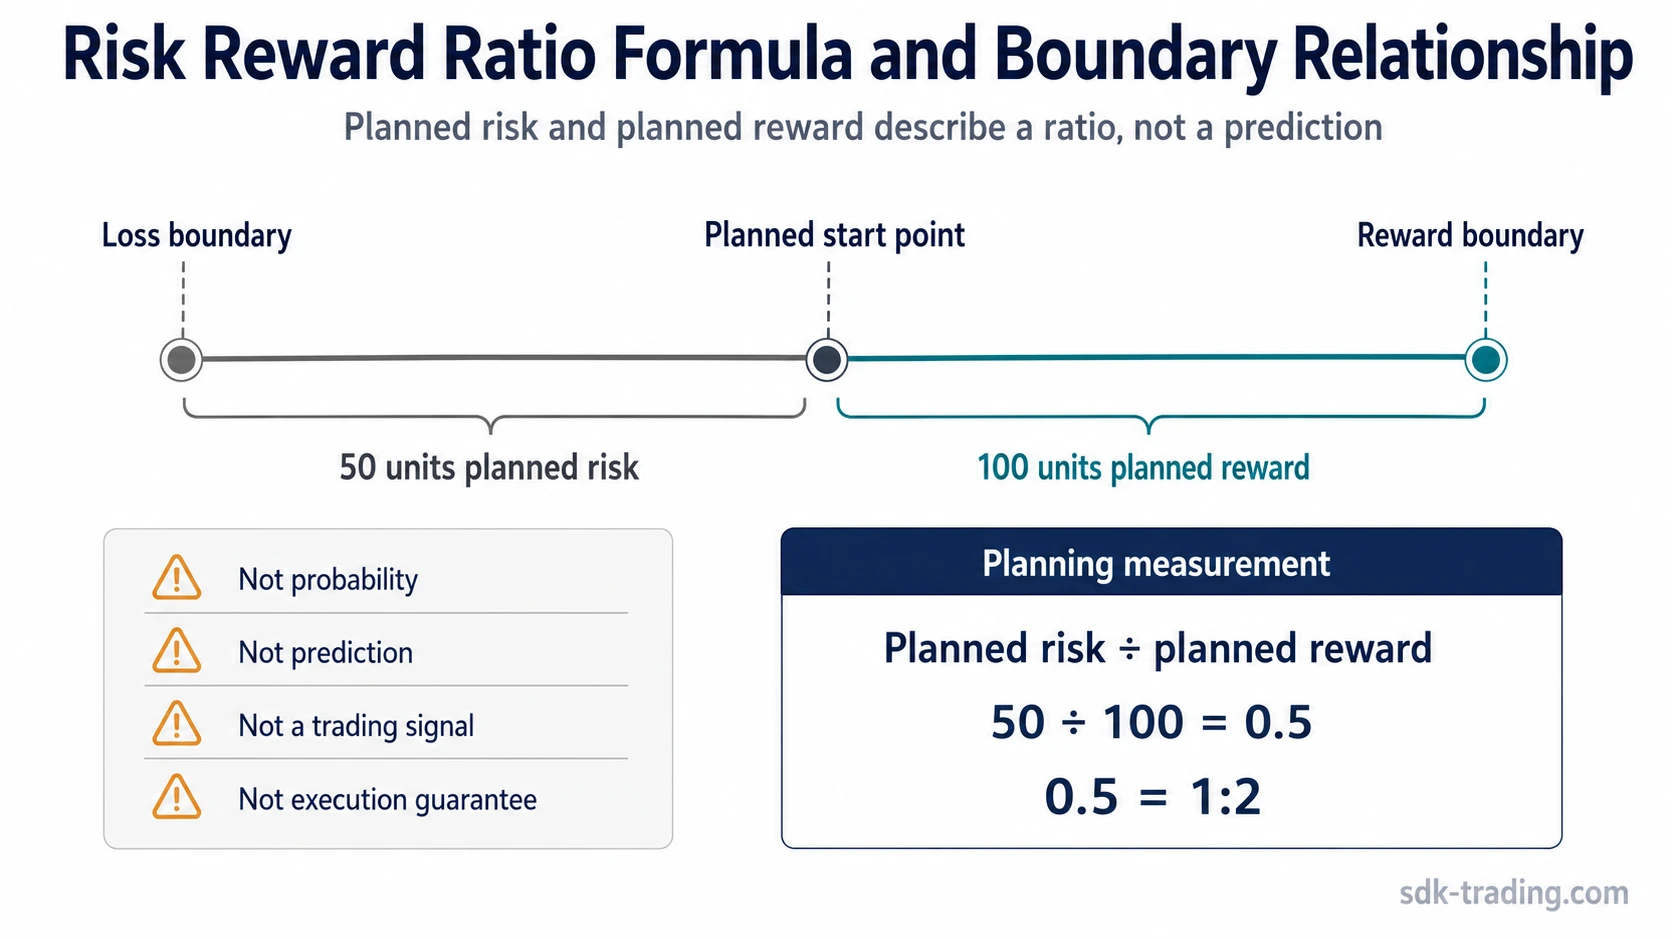
Risk reward ratio compares the amount a trader plans to risk with the potential reward planned before the outcome is known. If the planned loss side is 50 units and the planned reward side is 100 units, the risk reward ratio is 1:2, or 0.5 when written as planned risk divided by planned reward.
The ratio is a planning measurement. It can describe the relationship between a loss boundary and a reward boundary, but it does not predict whether price will reach either side, does not estimate win probability, and does not guarantee final execution.
Definition: Risk reward ratio is the relationship between planned risk and planned potential reward before a trading outcome is known. In risk-first notation, one unit of planned risk for two units of planned reward is written as 1:2.
Key Points
- Risk reward ratio compares planned risk with planned potential reward.
- A 1:2 ratio means one unit of planned risk for two units of planned reward.
- The ratio does not estimate win probability or guarantee execution.
- A high ratio can still be weak if the reward side is unrealistic or the risk side is changed after planning.
What Is Risk Reward Ratio?
Risk reward ratio is a trading risk measurement that compares the planned downside of a position with its planned upside. The risk side is the amount that could be lost if the loss boundary is reached. The reward side is the amount that could be gained if the planned reward boundary is reached.
The useful part of the ratio is not the number alone. The useful part is the relationship between two planned boundaries. A ratio only becomes meaningful when both sides are defined clearly enough to compare.
A 1:3 ratio may look attractive, but the reward side can still be unrealistic, the loss side can still be too loose, or the actual result can differ from the plan.
Risk Reward Ratio Formula
The basic risk-first formula is:
Formula: Risk reward ratio = planned risk / planned reward
If planned risk is 50 units and planned reward is 100 units, the calculation is 50 / 100 = 0.5. In trading notation, that is commonly expressed as 1:2 because the plan risks one unit to pursue two units of potential reward.
Some traders and platforms reverse the wording and use reward-to-risk ratio. In that format, the same plan may be described as 2:1 because the reward side is placed first. The underlying comparison is the same, but the order of the numbers changes.
| Format | Calculation | Meaning |
|---|---|---|
| Risk reward ratio | Planned risk / planned reward | Risk-first expression, such as 1:2 |
| Reward-to-risk ratio | Planned reward / planned risk | Reward-first expression, such as 2:1 |
How to Read 1:2 and 1:3 Risk Reward Ratios
A 1:2 risk reward ratio means the planned reward is twice the planned risk. A 1:3 ratio means the planned reward is three times the planned risk. These expressions describe a planned relationship, not a forecast.
| Risk-first notation | Decimal form | Plain meaning |
|---|---|---|
| 1:1 | 1.00 | One unit of planned risk for one unit of planned reward |
| 1:2 | 0.50 | One unit of planned risk for two units of planned reward |
| 1:3 | 0.33 | One unit of planned risk for three units of planned reward |
A lower decimal value can represent a larger reward side when the formula is risk divided by reward. Without a clear convention, 0.5, 1:2, and 2:1 can be confused even when they refer to the same planned relationship.
Risk Side vs Reward Side
The risk side is the planned amount exposed if the loss boundary is reached. In many examples, that side is shaped by the distance between the planned starting point and the loss boundary, sometimes described through stop distance.
The planned starting point in an example is often an entry price, but the ratio itself does not tell a trader where that price should be. It only compares the planned distance or value on the risk side with the planned distance or value on the reward side.
The reward side is usually framed around a planned profit boundary or exit price. That boundary may be based on a method, structure, or planning rule, but the ratio does not prove that the boundary is realistic.
| Part of the plan | What it represents | Why it matters for the ratio |
|---|---|---|
| Planned risk side | The loss amount if the unfavorable boundary is reached | Defines the first number in risk-first notation |
| Planned reward side | The potential gain if the favorable boundary is reached | Defines the second number in risk-first notation |
| Ratio expression | The comparison between the two planned sides | Shows planned asymmetry before the outcome is known |
| Actual result | The final realized gain or loss after execution | May differ from the planned ratio because market movement and execution can vary |
Risk Reward Ratio Example
Illustrative example: A planned position risks 50 units to pursue 100 units of potential reward. The planned risk reward ratio is 50 / 100 = 0.5, commonly expressed as 1:2.
The calculation is illustrative only. It does not say that the reward side will be reached, that the loss side will be filled at an exact level, or that the plan has positive expectancy.
If the risk side is later widened to 75 units while the reward side remains 100 units, the ratio changes. The new calculation is 75 / 100 = 0.75, or roughly 1:1.33. The original 1:2 label no longer describes the updated plan.
Why a Higher Risk Reward Ratio Is Not Automatically Better
A higher ratio can be useful only when the reward side is realistic enough and the risk side is controlled enough to remain meaningful. A distant reward boundary can make a ratio look attractive on paper while adding little practical value if the plan has a low chance of reaching it.
The ratio also needs win-rate or expectancy context. A plan with a large reward side can still perform poorly if losses occur too often, costs are high, execution is inconsistent, or the planned boundaries are repeatedly changed.
Limitation: Risk reward ratio measures planned payoff asymmetry. It does not measure probability, does not replace expectancy, does not control position size, and does not prove trade quality by itself.
| What the ratio can show | What it cannot show by itself |
|---|---|
| The planned relationship between loss and reward boundaries | Whether either boundary is likely to be reached |
| The size of planned reward compared with planned risk | The win rate needed for the approach to remain viable |
| Whether the plan has payoff asymmetry on paper | Whether the reward boundary is realistic in current conditions |
| How the plan looked before the outcome | The final realized fill, slippage, fees, or execution quality |
Common Misunderstandings
Risk reward ratio is often misread because the notation looks precise. The number can be calculated cleanly, but the interpretation still depends on the quality of the planned boundaries and the broader risk process.
| Misunderstanding | Safer interpretation |
|---|---|
| Confusing risk reward ratio with position size | The ratio compares planned loss and planned reward; position size determines how much account capital is exposed. |
| Assuming a high ratio means high probability | A larger reward side does not automatically make the outcome more likely. |
| Moving the loss boundary after planning | Changing the risk side changes the real ratio and can invalidate the original comparison. |
| Treating the ratio as a trading signal | The ratio describes the plan’s structure; it does not create an entry, exit, or market view. |
Risk Reward Ratio and Related Risk Concepts
Risk reward ratio is separate from risk per trade. The ratio compares planned downside with planned upside, while risk per trade deals with how much account exposure is placed at risk on a single idea.
It is also different from risk of ruin. Risk reward ratio looks at one planned payoff relationship, while risk of ruin deals with account survival across repeated losses and capital depletion.
Maximum drawdown and position sizing are nearby concepts, but they answer different questions. Maximum drawdown describes decline from a prior peak to a later trough, while position sizing controls exposure. Risk reward ratio stays narrower: it compares the planned loss side with the planned reward side before the result is known.
FAQ
How do you calculate risk reward ratio?
Calculate risk reward ratio by dividing planned risk by planned reward. If planned risk is 50 units and planned reward is 100 units, the calculation is 50 / 100 = 0.5, commonly expressed as 1:2.
What does a 1:2 risk reward ratio mean?
A 1:2 risk reward ratio means the plan risks one unit to pursue two units of potential reward. It describes planned asymmetry, not the probability of success.
Is a higher risk reward ratio always better?
No. A higher ratio can still be weak if the reward boundary is unrealistic, the risk side is changed after planning, execution differs from the plan, or the win-rate context is ignored.
Is risk reward ratio the same as position sizing?
No. Risk reward ratio compares planned risk with planned reward. Position sizing determines how much account capital is exposed to the planned risk.