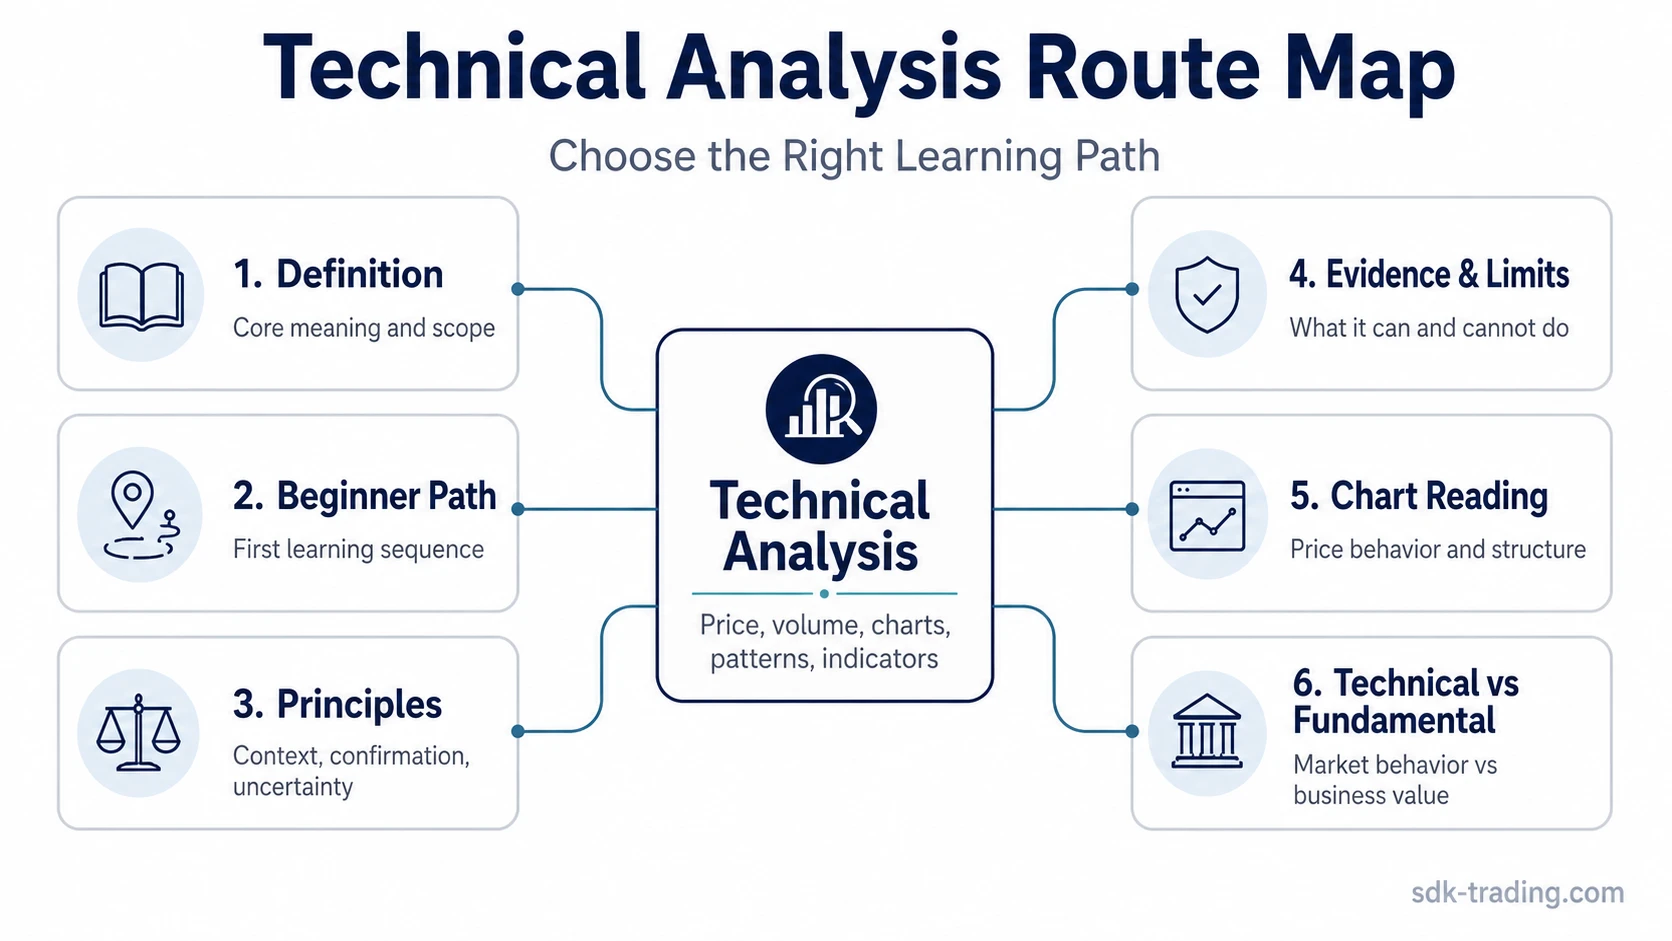
Technical analysis is a market interpretation method that studies price, volume, charts, trends, patterns, and indicators to understand how market behavior is developing. It does not replace risk control, predict the market with certainty, or prove that a move will continue. Different readers need different starting points, so technical analysis is easier to use when definition, chart reading, principles, evidence, and comparison paths are separated before deeper study.
Definition: Technical analysis uses market-generated data, especially price, volume, and chart structure, to interpret supply, demand, trend behavior, momentum, support and resistance, and pattern context.
Route-first reading: Technical analysis is easier to study when the broad method is separated into narrower questions: definition, beginner sequence, principles, evidence, chart reading, and comparison with fundamental analysis.
Key Points
- Technical analysis focuses on price, volume, chart structure, indicators, patterns, and market behavior.
- It is used to interpret conditions, not to guarantee market direction.
- Chart reading, indicators, candlestick patterns, support and resistance, and trend analysis are related areas, but each solves a different learning need.
- Technical analysis differs from fundamental analysis because it studies market behavior rather than company value, earnings, balance sheets, or business quality.
- The strongest learning path depends on whether the reader needs a definition, a beginner route, chart-reading help, principles, evidence, or a comparison with fundamental analysis.
Where to Start With Technical Analysis
Technical analysis is broad enough to create confusion if every subtopic is treated as one lesson. A cleaner approach is to match each question to the right destination: definition, beginner orientation, chart reading, principles, evidence, or comparison.
| If you need to understand… | Start with… | Why that path fits |
|---|---|---|
| The basic meaning of technical analysis | What is technical analysis | It defines the concept directly and separates technical analysis from broader trading education. |
| The first learning sequence | Technical analysis for beginners | It gives a beginner route without forcing every chart concept into one broad container. |
| The main assumptions behind the method | Core principles of technical analysis | It focuses on the ideas behind price behavior, trend, confirmation, and market structure. |
| Whether technical analysis is useful or limited | Does technical analysis work | It handles evidence, limitations, uncertainty, and the risk of treating chart signals as proof. |
| How to read price charts | How to read stock charts | It moves from the broad method into chart structure, price movement, and visual market behavior. |
| How technical analysis differs from company research | Technical analysis vs fundamental analysis | It separates market-behavior analysis from business, earnings, valuation, and financial-statement analysis. |
Main Areas of Technical Analysis
Technical analysis is not one indicator, one pattern, or one chart setup. It is a group of methods for reading how price and volume behave over time. The main areas below should be treated as separate tools, not as interchangeable signals.
| Area | What it helps interpret | Common mistake |
|---|---|---|
| Chart reading | How price moves across time, ranges, trends, gaps, reactions, and visible turning areas. | Reading the chart shape without asking what the structure actually shows. |
| Price action | How candles, swings, breakouts, pullbacks, and reactions behave without relying only on indicators. | Treating one candle or wick as a complete conclusion. |
| Support and resistance | Where price has previously reacted, paused, rejected, accepted, or changed behavior. | Assuming a level must hold because it was important before. |
| Candlestick patterns | How individual or grouped candles reflect pressure, hesitation, rejection, or continuation attempts. | Using a pattern name without checking trend, location, volume, or later confirmation. |
| Chart patterns | How repeated structures such as ranges, breakouts, reversals, and consolidations may develop. | Labeling a shape too early before the structure is complete. |
| Indicators | How trend, momentum, volatility, volume, or mean-reversion conditions can be summarized mathematically. | Ranking indicators as if one tool can replace context. |
| Principles and limitations | Why technical analysis uses confirmation, uncertainty, context, and conditional interpretation. | Turning a probabilistic reading into a prediction claim. |
How Technical Analysis Uses Price, Volume, and Charts
Price shows where transactions occur. Volume shows how much activity accompanies those transactions. Charts organize both into a visible sequence so a reader can study trend, range, reaction, acceptance, rejection, and volatility. This makes technical analysis useful as a market-behavior lens, but it also creates a risk: the same pattern can mean different things in different locations.
Example: A breakout above a prior high may show strength if price accepts above the level and volume supports the move. The same first break may weaken if price quickly returns below the level and fails to hold acceptance. The first event starts the question; later behavior changes the reading.
This is why technical analysis should not be reduced to pattern names. A candlestick pattern, moving average, support zone, or chart formation becomes more meaningful only when it is read with surrounding structure.
Technical Analysis vs Fundamental Analysis
Technical analysis studies market behavior. Fundamental analysis studies the underlying value, quality, financial position, earnings power, and business context of an asset or company. The two methods can address different questions.
| Method | Main focus | Typical question |
|---|---|---|
| Technical analysis | Price, volume, trend, chart structure, indicators, patterns, and market behavior. | What is price behavior showing now? |
| Fundamental analysis | Business quality, earnings, cash flow, valuation, balance sheet, and economic value. | What is the asset or company worth under the available evidence? |
The distinction matters because a technically strong chart does not automatically prove strong fundamentals, and strong fundamentals do not automatically create immediate chart confirmation. Treating the two as separate lenses reduces overconfidence.
What Technical Analysis Can and Cannot Do
Technical analysis can organize market behavior, highlight structure, show changing participation, and help compare current price action with prior reactions. It can also help readers avoid treating every market movement as random noise.
Limitation: Technical analysis cannot guarantee direction, remove uncertainty, or turn a chart pattern into proof. A signal can fail, a level can break, an indicator can lag, and a pattern can be reclassified when later price behavior changes the structure.
For that reason, technical analysis is strongest when it is used as a conditional interpretation tool. The question is not whether a chart label sounds bullish or bearish. The better question is whether price, volume, location, structure, and confirmation support the reading.
Choosing the Right Technical Analysis Path
A broad technical-analysis question usually becomes clearer when it is narrowed into meaning, sequence, evidence, chart reading, or method comparison. Each route answers a different problem and reduces the risk of treating technical analysis as one universal signal system.
- Meaning: use a definition-first route when the term itself is unclear.
- Sequence: use a beginner route when the learning order matters.
- Evidence: use an evidence and limitation route when the main question is what technical analysis can and cannot support.
- Charts: use a chart-reading route when the main problem is visual price behavior.
- Comparison: use a technical-versus-fundamental route when the distinction between market behavior and business value matters.
FAQ
What is technical analysis?
Technical analysis is the study of price, volume, charts, indicators, patterns, and market behavior to interpret how supply, demand, trend, momentum, and structure may be developing.
Is technical analysis the same as chart reading?
No. Chart reading is one part of technical analysis. Technical analysis can also include indicators, trend studies, support and resistance, candlestick patterns, chart patterns, volume, and principles for interpreting uncertainty.
How is technical analysis different from fundamental analysis?
Technical analysis studies market behavior through price and volume. Fundamental analysis studies business quality, earnings, cash flow, valuation, and economic value.
Does technical analysis predict the market?
Technical analysis does not predict the market with certainty. It can help organize evidence and interpret behavior, but signals can fail and every reading remains conditional on context and later confirmation.