Technical analysis vs fundamental analysis separates two different evidence lenses. Technical analysis studies price, volume, chart structure, trend behavior, and reference levels. Fundamental analysis studies business quality, earnings, valuation, economic conditions, and industry drivers. The useful question is not which method is universally better, but which lens answers the specific question being asked.
Key Points
- Technical analysis reads market behavior through price, volume, trend, structure, and levels.
- Fundamental analysis reads business and economic drivers such as earnings quality, valuation, balance-sheet strength, industry conditions, and macro sensitivity.
- Technical evidence often helps frame timing, acceptance, rejection, volatility, and market participation.
- Fundamental evidence often helps frame business quality, value assumptions, earnings durability, and broader economic exposure.
- Both lenses can be combined, but agreement between them does not prove direction, outcome, or trade quality.
Technical Analysis vs Fundamental Analysis: The Core Difference
Technical analysis starts from observable market behavior. It asks what price and volume reveal about participation, pressure, trend, range behavior, acceptance, rejection, and volatility. A technical reading can help organize what the market is currently doing, but it does not explain the full business or economic reason behind every price move.Fundamental analysis starts from the underlying asset or business. It asks whether financial performance, earnings durability, valuation, industry structure, economic conditions, and company-specific drivers support a stronger or weaker value case. A fundamental reading can explain why an asset may deserve attention, but it does not guarantee that market participants will recognize that view at a specific moment.The two methods often answer different questions. Technical analysis is usually better suited to market-behavior questions. Fundamental analysis is usually better suited to value-driver questions. Confusion begins when either method is treated as a prediction engine rather than an evidence framework.When the question moves from chart behavior to company evidence, the next step is usually an investment research process that tests the story, financial evidence, valuation context, and risk before any investor decision is considered.
Comparison Table: Evidence, Purpose, Time Horizon, and Limits
| Criteria | Technical analysis | Fundamental analysis |
|---|---|---|
| Main question | How is the market behaving now? | What underlying drivers may support or weaken value? |
| Evidence used | Price, volume, chart structure, trend, volatility, support and resistance, breakouts, ranges, and acceptance or rejection around levels. | Revenue, earnings, margins, cash flow, balance sheet, valuation, business model, management decisions, industry structure, and economic conditions. |
| Typical use | Organizing market behavior, timing context, participation, structure, and changing pressure. | Understanding business quality, valuation assumptions, earnings durability, and economic sensitivity. |
| Time horizon tendency | Often used for shorter-term and intermediate market behavior, though it can also frame longer-term trend structure. | Often used for longer-term value and business analysis, though it can also affect shorter-term reactions around new information. |
| Strength | Shows what market participants are doing rather than what they are expected to do. | Explains the underlying reasons an asset may be stronger, weaker, cheaper, expensive, improving, or deteriorating. |
| Limitation | Chart behavior can change quickly and can be misleading when structure is weak, volume is thin, or context is ignored. | Strong fundamentals can remain unrecognized by the market for long periods, and valuation assumptions can be wrong. |
| What it cannot prove | It cannot prove future direction, outcome, or the reason behind every move. | It cannot prove that the market will accept the valuation view or reprice the asset within a specific timeframe. |
When Each Lens Is More Useful
The choice depends on the question. A chart question, a valuation question, and a business-quality question should not be forced into the same method.
| Question being asked | More useful lens | Reason |
|---|---|---|
| Is price accepting or rejecting an important area? | Technical analysis | Acceptance and rejection are market-behavior questions visible through price action, volume, and follow-through. |
| Is a trend strengthening, weakening, or becoming unstable? | Technical analysis | Trend structure, volatility, momentum behavior, and participation help classify the current market condition. |
| Is the business improving or deteriorating? | Fundamental analysis | Business quality depends on financial performance, earnings durability, margins, cash flow, and competitive position. |
| Is the valuation reasonable relative to the evidence? | Fundamental analysis | Valuation depends on assumptions about earnings, growth, risk, discount rates, and industry context. |
| Does the market behavior support the underlying thesis? | Both, used separately | Fundamentals can frame the thesis, while technical evidence can show whether market behavior is aligned, mixed, or rejecting the idea. |
| Is agreement between the two methods enough? | Neither alone | Agreement can improve context, but it does not remove uncertainty or prove that a future move must occur. |
Evidence Inputs: Chart Behavior vs Value Drivers
Technical and fundamental analysis can both be detailed, but they collect different types of evidence. Mixing them without separating their roles can create false confidence.
| Evidence category | Technical reading | Fundamental reading |
|---|---|---|
| Price movement | Shows where participants are accepting, rejecting, accelerating, hesitating, or defending areas. | May reflect changing expectations about business performance, valuation, macro conditions, or new information. |
| Volume | Helps judge participation behind a move, though volume alone does not prove intent. | Usually secondary unless volume relates to ownership changes, liquidity, index flows, or event-driven participation. |
| Trend | Frames direction, structure, continuation attempts, and possible weakening. | May reflect improving or deteriorating expectations, but the chart itself does not identify the exact cause. |
| Earnings and cash flow | Not directly measured by the chart, though reactions around reports can become technical evidence. | Central evidence for business quality, durability, reinvestment capacity, and valuation assumptions. |
| Valuation | Not a chart input unless the market begins behaving differently around valuation-sensitive information. | Central evidence for whether expectations appear demanding, reasonable, or depressed relative to the underlying business. |
| Economic and industry conditions | Can appear indirectly through trend, volatility, relative strength, and market participation. | Directly relevant when growth, rates, inflation, regulation, commodity prices, or industry cycles affect the business case. |
Same Market Move, Different Meaning
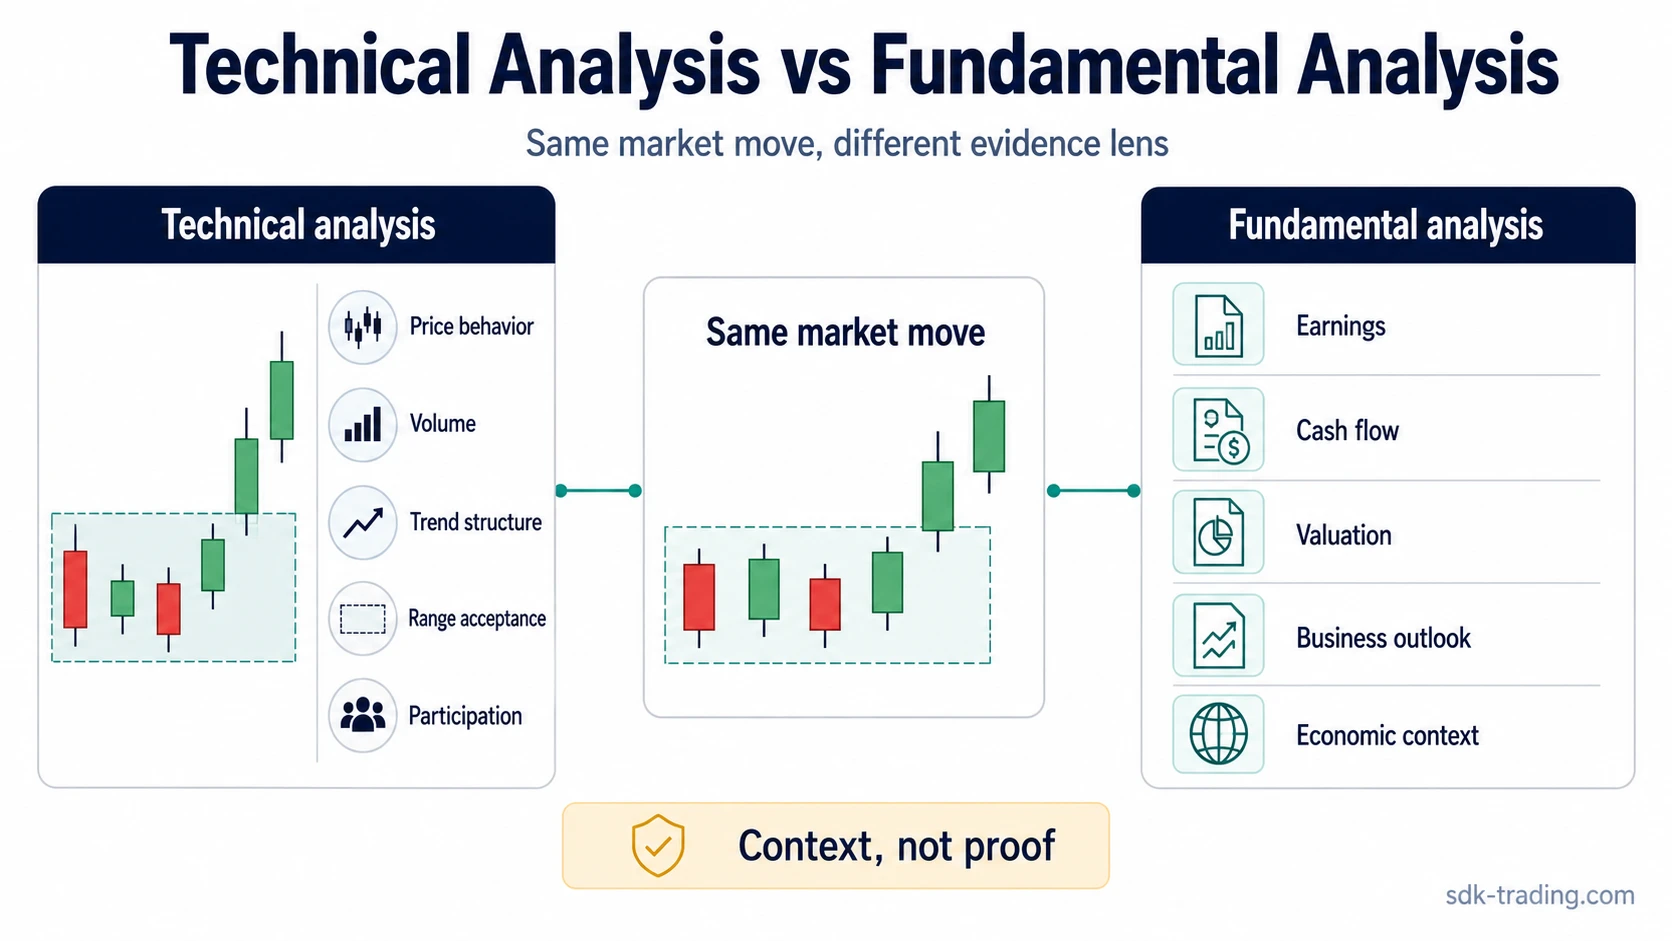
The same price move can therefore carry two different interpretations. A technical analyst may describe a change in market behavior. A fundamental analyst may question whether the move is justified by business evidence. Neither interpretation is complete by itself unless the question being asked matches the evidence being used.
Can Technical and Fundamental Analysis Be Combined?
Technical and fundamental analysis can be combined when their roles stay separate. A fundamental view can explain why an asset may deserve attention. A technical view can show whether current market behavior is supporting, rejecting, or not yet confirming that view.A practical combination might separate the work into three questions:
- Thesis question: Do business, earnings, valuation, industry, or economic factors support the idea?
- Behavior question: Does price and volume behavior show acceptance, participation, trend quality, or rejection?
- Risk-boundary question: What evidence would weaken the interpretation?
Combining the methods becomes risky when agreement is treated as proof. Confluence can organize evidence, but it does not remove uncertainty. A clean fundamental case can fail to gain market acceptance, and a clean technical structure can fail if the underlying driver changes.
Common Mistakes and Limitations
| Mistake | Why it creates risk | Safer interpretation |
|---|---|---|
| Treating technical analysis as prediction | Chart structure describes behavior and conditions, not a certain future path. | Use technical evidence to classify current behavior, not to claim certainty. |
| Treating fundamentals as timing proof | A strong business case can remain ignored or mispriced for a long time. | Separate value evidence from market acceptance and timing. |
| Assuming technical means short-term only | Charts can frame longer-term trend and structure, not only short-term moves. | Match the chart timeframe to the question being asked. |
| Assuming fundamental means long-term only | Fundamental information can affect short-term reactions when expectations change quickly. | Separate the durability of the driver from the speed of the market reaction. |
| Forcing one method to answer every question | A chart cannot fully measure business quality, and financial statements cannot fully describe current market participation. | Use the lens that fits the evidence needed. |
| Treating agreement as proof | When both methods point in the same direction, the setup may feel stronger than the evidence actually supports. | Agreement can improve context, but uncertainty, invalidation, and changing conditions still matter. |
Which Method Fits Which Decision Question?
Technical analysis is usually the cleaner lens when the question is about market behavior: trend, range, volatility, participation, level acceptance, failed continuation, or rejection. Fundamental analysis is usually the cleaner lens when the question is about business quality, earnings durability, valuation, macro exposure, or industry position.The strongest use is often not choosing one method permanently. The stronger discipline is knowing which question is being answered. A chart can show that market behavior has changed before the underlying reason is fully understood. Fundamental evidence can show that a business case is improving before price behavior reflects broad acceptance. Both situations require qualification rather than certainty.
FAQ
Is technical analysis only for short-term trading?
No. Technical analysis is often used for shorter-term timing and market-behavior questions, but it can also frame longer-term trend structure, ranges, and major areas of acceptance or rejection.
Can technical and fundamental analysis be used together?
Yes. They can be used together when each lens keeps a separate job. Fundamentals can frame the underlying thesis, while technical evidence can show whether market behavior supports, rejects, or has not yet confirmed that thesis.
Does agreement between technical and fundamental analysis prove an outcome?
No. Agreement can improve context, but it does not prove future direction or remove uncertainty. Both methods can be wrong, incomplete, or weakened by changing conditions.