Volatility indicators in trading classify price expansion, contraction, channel width, range behavior, and statistical dispersion. The useful question is which volatility tool fits the type of market movement being analyzed.
Definition: Trading volatility indicators measure or visualize how much price movement is expanding, contracting, or deviating from a reference range or baseline. They do not measure trend direction by themselves. Their role is to classify range pressure, channel behavior, dispersion, and changing market conditions.
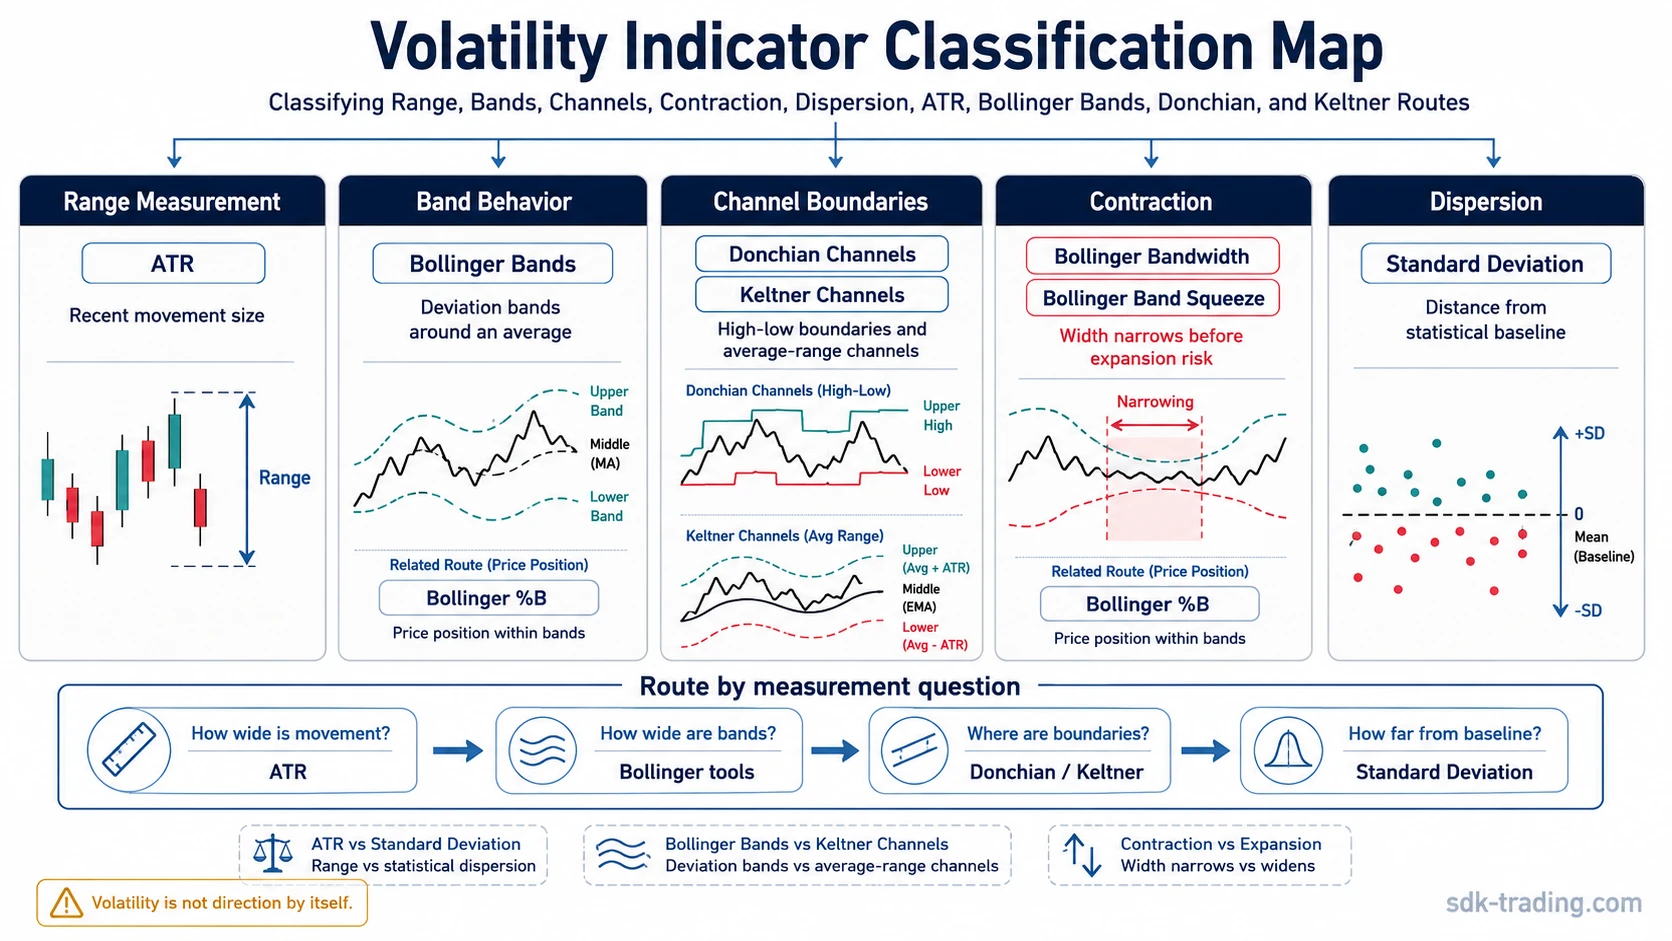
Volatility tools separate ATR-style range measurement, Bollinger-style band behavior, channel-based breakout context, statistical dispersion, and volatility contraction. Each group answers a different question, so the indicator choice should follow the type of price movement being studied.
Key Points
- Volatility indicators focus on the size, width, expansion, contraction, or dispersion of price movement.
- They are different from trend indicators, which focus on direction, and oscillators, which often focus on momentum or threshold behavior.
- ATR, Bollinger Bands, Keltner Channels, Donchian Channels, standard deviation, Bollinger Bandwidth, and Bollinger %B answer different volatility questions.
- A volatility reading becomes weaker when it is used as a direction signal without price structure, trend context, or range behavior.
Volatility Indicator Choice Map
The volatility group is easiest to read by separating calculation input from visual behavior. Some tools measure true range, some build bands around an average, some mark price channels, and others quantify how far price has moved from a statistical baseline.
| Reader question | Best route | Calculation boundary |
|---|---|---|
| How much has price been moving across recent candles? | ATR indicator | Uses true range logic to estimate recent movement size. |
| Is price volatility expanding or contracting around a moving average? | Bollinger Bands | Uses standard deviation bands around a moving average. |
| Is volatility narrowing into a compression phase? | Bollinger Band Squeeze | Focuses on band contraction before possible volatility expansion. |
| How wide are Bollinger Bands relative to their own baseline? | Bollinger Bandwidth | Measures the distance between the upper and lower Bollinger Bands. |
| Where is price located inside the Bollinger Band structure? | Bollinger %B | Converts price position inside or outside the bands into a relative reading. |
| How can volatility be tracked through an average range channel? | Keltner Channels | Uses average range behavior around a central moving average. |
| Where are the highest high and lowest low over a lookback window? | Donchian Channels | Maps price channel boundaries from recent highs and lows. |
| How far is price dispersion from a statistical baseline? | standard deviation indicator | Measures dispersion from an average rather than directional trend. |
How Volatility Indicators Differ From Nearby Indicator Groups
Volatility indicators describe movement width and expansion behavior. Trend indicators describe directional bias. Oscillators usually describe momentum, range position, or threshold behavior. Volume indicators describe participation. Mixing these categories can make a volatility reading look more directional than it really is.
| Indicator group | Main reading | Boundary against volatility tools |
|---|---|---|
| Volatility indicators | Movement size, range width, dispersion, channel expansion, or contraction. | They describe how much price is moving, not whether the move is bullish or bearish by themselves. |
| Trend indicators | Directional bias, moving-average slope, trend strength, or trend-following structure. | A trend can be rising while volatility is expanding, contracting, or unstable. |
| Oscillators | Momentum, overbought and oversold behavior, range position, or zero-line movement. | An oscillator can show momentum pressure while volatility tools show whether movement is widening or narrowing. |
| Volume indicators | Participation, flow, accumulation, distribution, or pressure behind movement. | Volume can confirm or weaken a volatility expansion, but it is not the same measurement. |
Core Volatility Reading Paths
Volatility tools become clearer when the measurement path is defined first. ATR is usually a range-size route. Bollinger tools are band and dispersion routes. Donchian Channels are boundary routes. Keltner Channels are average-range channel routes. Standard deviation is a statistical dispersion route.
Volatility scope boundary: A high-volatility reading does not automatically define trend direction. It only says that movement, range, dispersion, or channel behavior has changed. Direction still needs to be read through price structure, trend behavior, or another dedicated tool.
This boundary matters because a widening band, a rising ATR, or a Donchian breakout can appear during continuation, reversal attempts, liquidation moves, or noisy expansion. The volatility tool identifies the change in movement behavior; it does not complete the full interpretation alone.
Selected Framework and Comparison Routes
Broader volatility analysis often requires separating what is being measured. Range tools, dispersion tools, channel tools, and conditional frameworks answer different questions, so the same volatility reading should not be forced into every market situation.
| Reader problem | Best route | Use when |
|---|---|---|
| The reader needs a broader overview of the volatility indicator family. | volatility indicators explained | The question is broader than one tool but still belongs inside the volatility indicator group. |
| The reader wants to connect ATR to position sizing or risk context. | ATR in risk management | The question has moved from volatility measurement into risk framework usage. |
| The reader is comparing range-based volatility with statistical dispersion. | ATR vs standard deviation | The issue is true range behavior versus dispersion from an average. |
| The reader is comparing Bollinger and Keltner channel logic. | Bollinger Bands vs Keltner Channels | The question is standard-deviation bands versus average-range channels. |
| The reader wants a conditional framework around ATR use. | ATR strategy framework | The question has moved from definition into structured interpretation. |
| The reader wants a conditional framework around Bollinger Bands. | Bollinger Bands strategy framework | The question is about how band behavior fits into a broader reading process. |
Choosing the Right Volatility Route
Start with the measurement question. Use ATR when the issue is recent movement size, Bollinger tools when the issue is band width or price position inside bands, Donchian Channels when the issue is high-low boundary behavior, Keltner Channels when the issue is average-range channel structure, and standard deviation when the issue is statistical dispersion.
Then separate measurement from interpretation. A volatility expansion can show that market movement is becoming wider, but it does not decide whether the move is healthy, exhausted, trend-following, or unstable. The stronger reading comes from matching the volatility tool to the correct calculation input and then checking the surrounding price structure.