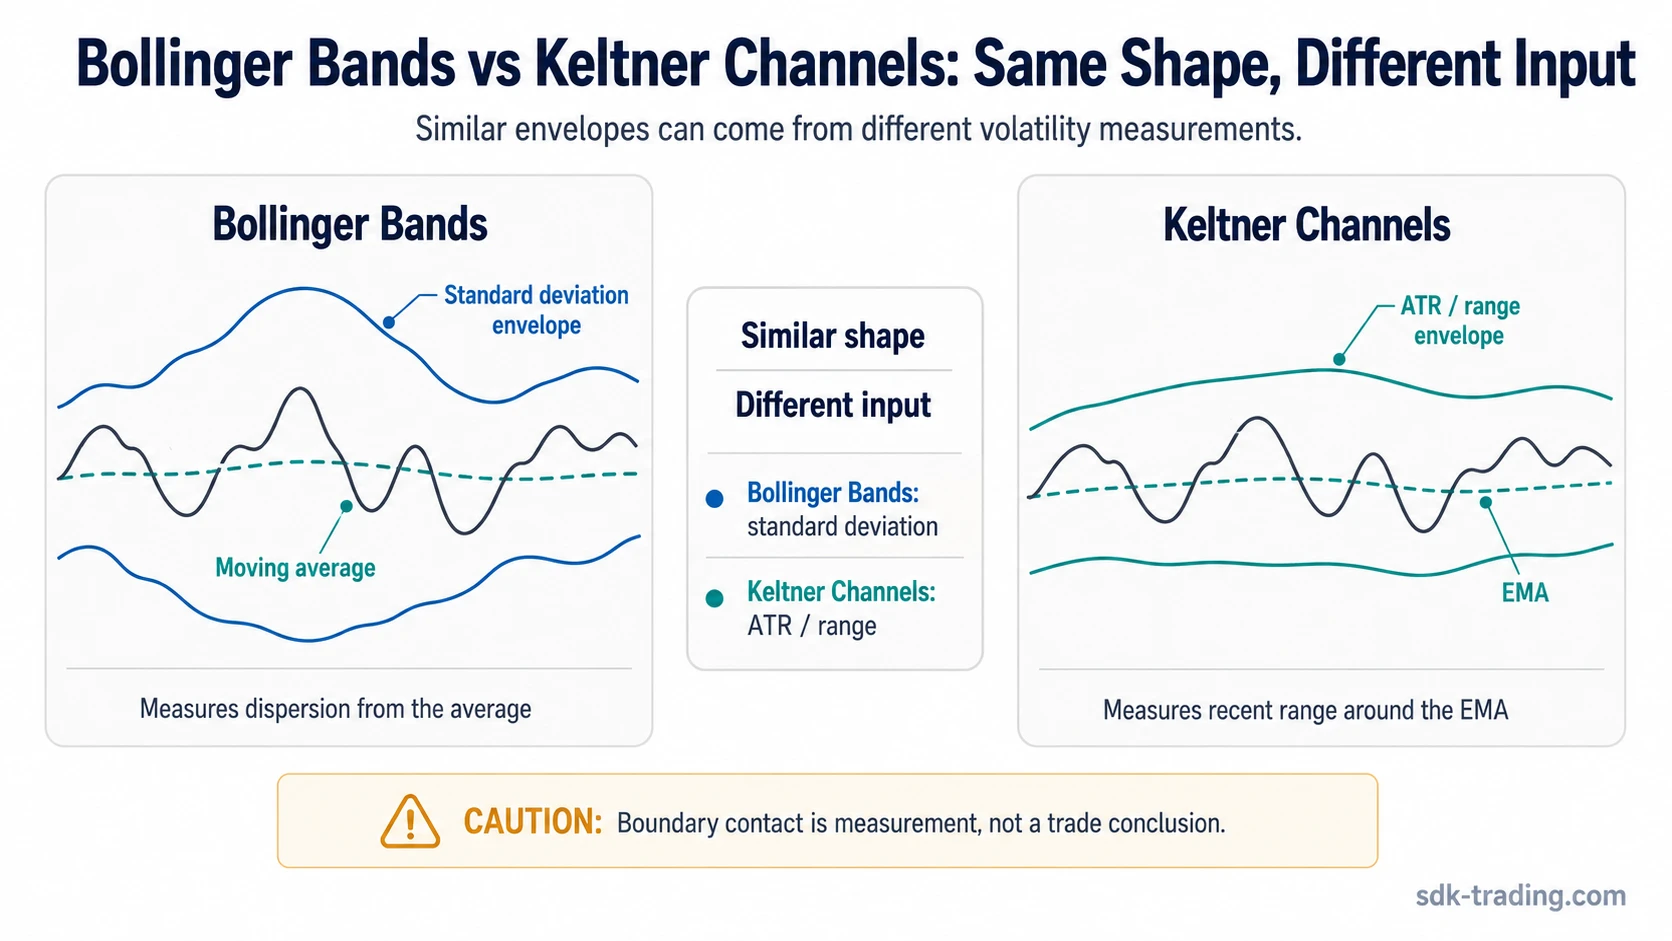
Bollinger Bands and Keltner Channels both draw volatility envelopes around price, but they do not measure volatility the same way. Bollinger Bands expand and contract with standard deviation around a moving average, while Keltner Channels use ATR or range around an EMA.
The practical difference is not which one is “better,” but which measurement lens fits the question being asked. Similar envelope shapes can create similar chart impressions, but the boundary has a different meaning when it is built from dispersion than when it is built from recent range.
Key differences at a glance
- Bollinger Bands use standard deviation; Keltner Channels use ATR or range.
- Similar envelope shape can produce different boundary readings.
- A band or channel touch is a measurement event, not a trade conclusion.
Bollinger Bands vs Keltner Channels: the core difference
The core difference is the volatility input. Bollinger Bands measure how far price is moving from an average using standard deviation, so the bands can widen sharply when price dispersion increases.
Keltner Channels use an EMA centerline with an ATR or range-based envelope, so the channel usually behaves more smoothly and reflects recent movement range rather than statistical dispersion from the average.
The same price location can carry different information. A move near the upper Bollinger Band may show extension relative to recent dispersion, while a move near the upper Keltner Channel may show price pressing against a range-adjusted envelope.
Where Bollinger Bands and Keltner Channels overlap
Both indicators belong to the same broad envelope family. They place an upper and lower boundary around price, use a centerline, and visually frame expansion or contraction in recent movement.
Shared role:
- Both plot boundaries around price.
- Both use a centerline as the reference area.
- Both adapt as recent volatility conditions change.
- Both can show wider or narrower movement conditions.
- Neither confirms direction, reversal quality, continuation quality, entry timing, or trade quality by itself.
The overlap is visual and functional, not mathematical. Both can help describe how price is behaving inside an envelope, but they are not interchangeable because the outer boundary is calculated from different inputs.
Where they diverge
The divergence comes from construction, sensitivity, and boundary meaning. Bollinger Bands are more directly tied to dispersion around an average. Keltner Channels are more directly tied to average true range or recent range behavior around an EMA.
| Feature | Bollinger Bands | Keltner Channels |
|---|---|---|
| Centerline | Usually a moving average, commonly an SMA | Usually an EMA |
| Outer boundary | Standard deviation above and below the average | ATR or range multiple above and below the EMA |
| Volatility input | Dispersion from the average | Recent range or average true range |
| Sensitivity | Can react sharply when dispersion expands | Usually smoother because the channel is range-adjusted |
| Boundary meaning | Price is far from the average relative to recent dispersion | Price is near a range-adjusted envelope around the EMA |
| Main false reading | Treating a band touch as an automatic reversal | Treating channel pressure as trend proof |
Same boundary touch, different reading
A useful comparison is a neutral scenario where price presses the upper boundary on both indicators. The chart may look similar because price is near the top of each envelope, but the volatility input is different.
Illustrative scenario: price presses the upper boundary:
- Bollinger Bands lens: price is extended relative to recent dispersion around the moving average.
- Keltner Channels lens: price is moving near a range-adjusted envelope around the EMA.
- Safe reading: the boundary contact changes the interpretation context, but it does not decide reversal, continuation, timing, or trade quality.
The common mistake is to treat the upper boundary as if it has one universal meaning. A touch can show extension, pressure, range expansion, or simple boundary contact depending on surrounding structure and volatility behavior. The indicator does not provide that conclusion alone.
Comparison by measurement question
After the construction difference is clear, the practical comparison is the question each envelope answers. The useful lens depends on whether the chart question is about dispersion, range, compression, or boundary behavior.
| Question | Bollinger Bands lens | Keltner Channels lens |
|---|---|---|
| What is being measured? | Dispersion around an average | Range-adjusted envelope behavior |
| What changes the boundary? | Standard deviation expansion or contraction | ATR or range expansion or contraction |
| How does the envelope react? | It can widen quickly when dispersion spikes | It usually changes more smoothly with recent range |
| What can mislead? | Reading a band touch as reversal confirmation | Reading channel contact as trend confirmation |
| What is the best diagnostic lens? | Whether price is stretched relative to recent dispersion | Whether price is moving near a range-adjusted envelope |
When each lens is more useful
Bollinger Bands are often more useful when the question is about dispersion: how far price has moved from the average relative to recent variation. Keltner Channels are often more useful when the question is about movement range: how price is behaving around a smoother ATR or range-adjusted envelope.
| Chart question | More useful lens |
|---|---|
| Is price stretched relative to recent dispersion? | Bollinger Bands |
| Is price moving near a smoother range-adjusted envelope? | Keltner Channels |
| Is volatility compression visible across both models? | Compare both, but do not infer direction from compression alone |
| Is a boundary touch meaningful? | Only after checking surrounding structure and context |
“Which one should I use?” is an incomplete question. The more precise question is whether the analysis needs a dispersion lens, a range lens, or a comparison between the two.
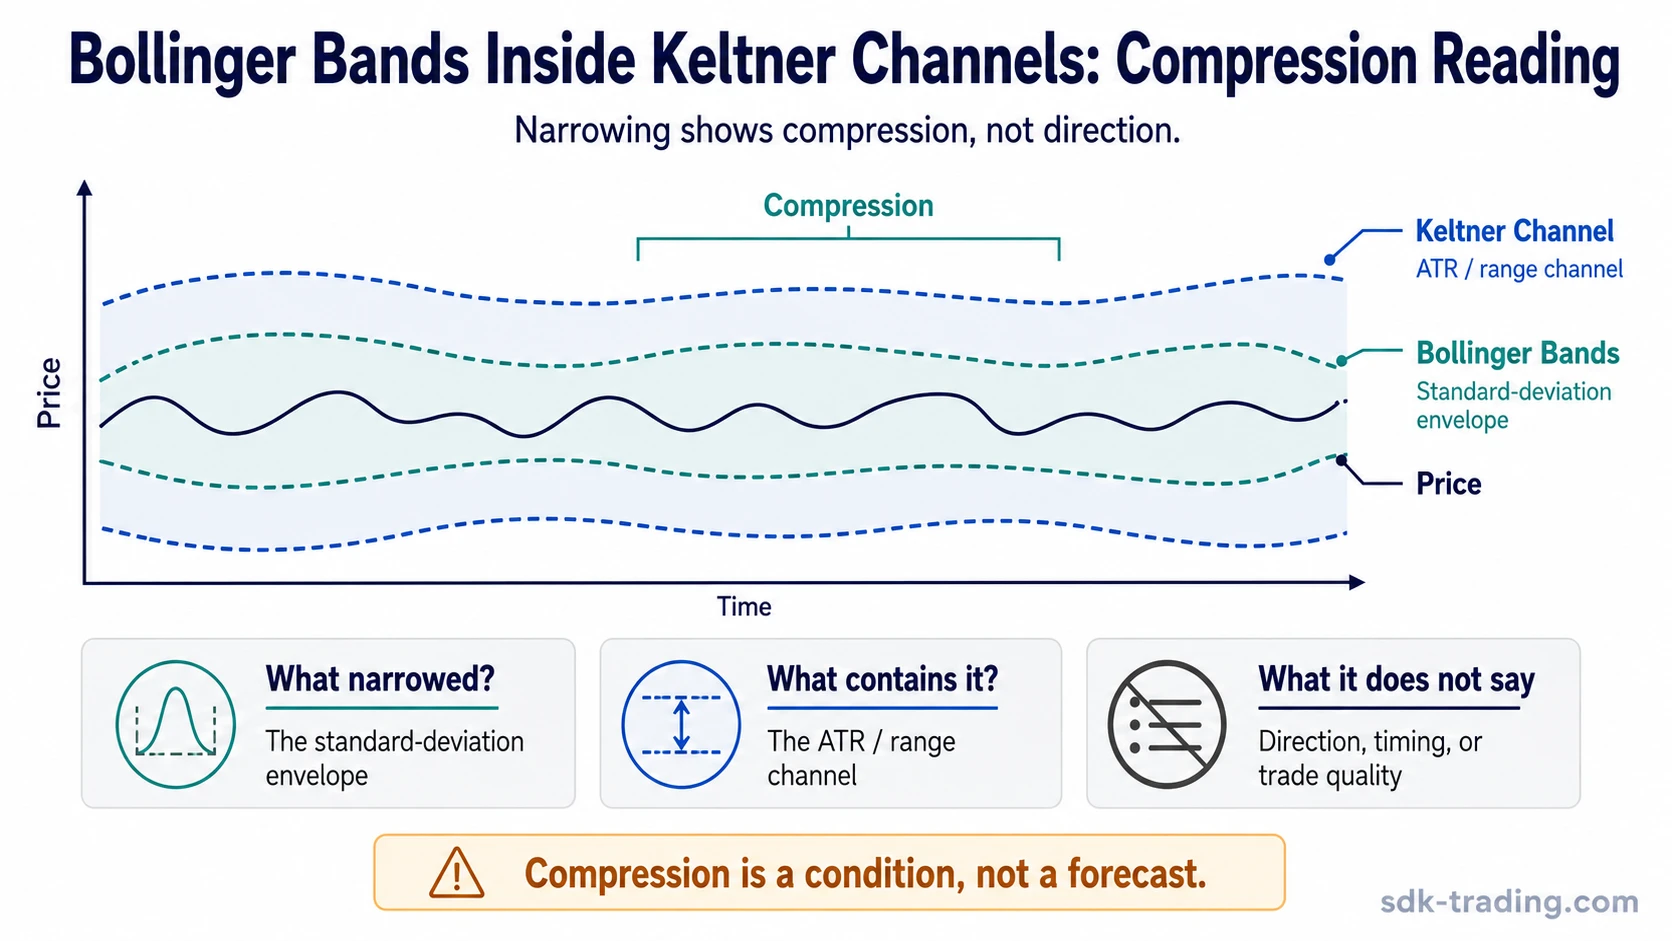
Bollinger Bands inside Keltner Channels
One common comparison is the condition where Bollinger Bands move inside Keltner Channels. This can describe compression because the standard-deviation envelope has narrowed relative to the range-adjusted channel.
Compression is a condition, not a directional forecast. It can show that recent movement has narrowed, but it does not identify breakout direction, timing, confirmation quality, or trade quality by itself.
Compression reading: Bollinger Bands inside Keltner Channels can help describe a narrow-volatility state. It should not be treated as a standalone signal, setup, entry trigger, or proof that expansion will resolve in a specific direction.
Settings differences without turning them into signals
Common Bollinger Band settings often use a moving average with standard-deviation bands, such as a 20-period average with two standard deviations. Keltner Channel settings often use an EMA with an ATR or range multiplier.
Changing settings changes the envelope. A shorter lookback may make the boundary more responsive, and a wider multiplier may move the outer bands farther from price. That does not mean the setting is more accurate, safer, or more predictive by itself.
Common false readings
The main risk in comparing these indicators is false equivalence. Similar envelope visuals can make the two tools look interchangeable, but their inputs and boundary meanings are different.
| False reading | Why it is incomplete | Safer interpretation |
|---|---|---|
| Similar shape means the same measurement | The envelopes can look alike while using different volatility inputs. | Separate standard deviation behavior from ATR or range behavior. |
| A Bollinger Band touch confirms reversal | A touch only shows price reaching a dispersion-based boundary. | Use the touch as context, not as reversal proof. |
| A Keltner Channel touch confirms trend quality | Channel contact shows pressure near a range-adjusted envelope. | Check surrounding structure before drawing a trend conclusion. |
| Bands inside channels predict breakout direction | Compression describes narrowed movement, not the future direction of expansion. | Treat compression as a condition that still needs separate context. |
| Settings make one indicator more reliable by default | Settings change sensitivity, smoothing, and boundary distance. | Read settings as measurement controls, not quality guarantees. |
Bottom line
Bollinger Bands and Keltner Channels are both envelope indicators, but they answer different volatility questions. Bollinger Bands focus on dispersion around an average. Keltner Channels focus on recent range or ATR around an EMA.
The strongest comparison is not which one is better. It is whether the chart question needs a dispersion lens, a range lens, or a comparison between both. Boundary contact, compression, and settings changes remain measurement information until separate context supports a stronger reading.
FAQ
Are Keltner Channels the same as Bollinger Bands?
No. They both create envelopes around price, but Bollinger Bands use standard deviation around an average, while Keltner Channels use ATR or range around an EMA.
Why do Bollinger Bands react differently from Keltner Channels?
Bollinger Bands react to dispersion from the average, so they can widen sharply when price variation increases. Keltner Channels usually respond more smoothly because they are based on recent range or ATR.
Can Bollinger Bands and Keltner Channels be used together?
Yes. They can be compared to see how dispersion-based and range-based envelopes behave in the same condition, but using both does not confirm direction, timing, or trade quality.
Does a band or channel touch mean reversal or continuation?
No. A touch only shows that price reached a measured boundary. Reversal or continuation requires separate context.