Bollinger Bands are a volatility indicator built around a moving average. The middle band tracks the average price over a selected period, while the upper and lower bands sit above and below it by a standard deviation multiple. When price dispersion increases, the bands widen. When dispersion decreases, the bands contract.
A band touch, a narrow squeeze, or a wide band expansion does not decide direction by itself. Bollinger Bands describe where price is trading relative to a recent average and recent dispersion. The reading becomes more useful when the band behavior is compared with price structure, follow-through, and whether the market accepts or rejects movement outside the envelope.
Key Points
- Bollinger Bands use a moving average, an upper band, and a lower band.
- The outer bands are usually based on standard deviation from the moving average.
- Band width expands and contracts with volatility, not with bullish or bearish direction alone.
- Outer-band contact can mark pressure, extension, or trend persistence, but not an automatic reversal.
What Are Bollinger Bands?
Bollinger Bands are an adaptive price envelope. Instead of using fixed levels, the bands adjust as recent price dispersion changes. A quiet market normally produces narrower bands, while a more active market normally produces wider bands.
The indicator is commonly used to read volatility conditions and relative price location. Price near the upper band is high relative to the recent moving average and dispersion range. Price near the lower band is low relative to the same reference. That position is descriptive. It does not automatically mean that price is too high, too low, or ready to reverse.
Bollinger Bands can describe range behavior, compression, expansion, and extension. They do not define trend direction, trade entry, exit, target, or stop placement.
How Bollinger Bands Are Calculated
Bollinger Bands start with a middle band, usually a moving average. The upper and lower bands are then placed a selected number of standard deviations above and below that average.
Conceptual formula:
- Middle Band = moving average
- Upper Band = moving average + standard deviation multiple
- Lower Band = moving average – standard deviation multiple
A common default uses a 20-period moving average with bands set 2 standard deviations above and below it. These parameters are common defaults, not universal rules. Faster or slower markets may require different assumptions, and detailed parameter comparison belongs with period and multiplier selection.
The exact default matters less than the mechanism: band distance changes as recent dispersion changes. When price outcomes are more spread out around the moving average, the envelope expands. When outcomes cluster closer to the average, the envelope contracts.
What the Upper, Middle, and Lower Bands Show
The middle band is the reference line. It represents the selected moving average and gives the outer bands their central anchor. Price above the middle band is trading above that average. Price below it is trading below that average.
The upper band marks the positive side of the envelope. A move toward or beyond it shows that price is extended relative to the recent average and dispersion range. That can occur during a sharp one-bar move, a strong continuation sequence, or a late extension that later fails.
The lower band marks the negative side of the envelope. A move toward or below it shows downside extension relative to the same statistical reference. That can occur during selling pressure, trend continuation, temporary panic, or a failed downside push.
Bollinger %B is a related way to express where price sits inside or outside the band envelope. Bollinger Bands show the envelope visually, while %B turns the price location into a separate relative-position reading.
How Band Expansion and Band Squeeze Change the Reading
Band expansion means the distance between the upper and lower bands is increasing. This usually reflects greater dispersion around the moving average. Expansion can appear during a directional move, a failed breakout, a sudden news reaction, or unstable back-and-forth movement.
Band contraction means the distance between the upper and lower bands is decreasing. This usually reflects lower dispersion and a more compressed range. A Bollinger Band Squeeze describes this narrow-band compression, but compression does not say which direction price will choose afterward.
Band width can also be measured separately through the width of the bands. That distinction matters because the visual envelope and the separate width measurement answer related but different questions: one frames price inside a moving band structure, while the other isolates how wide that structure has become.
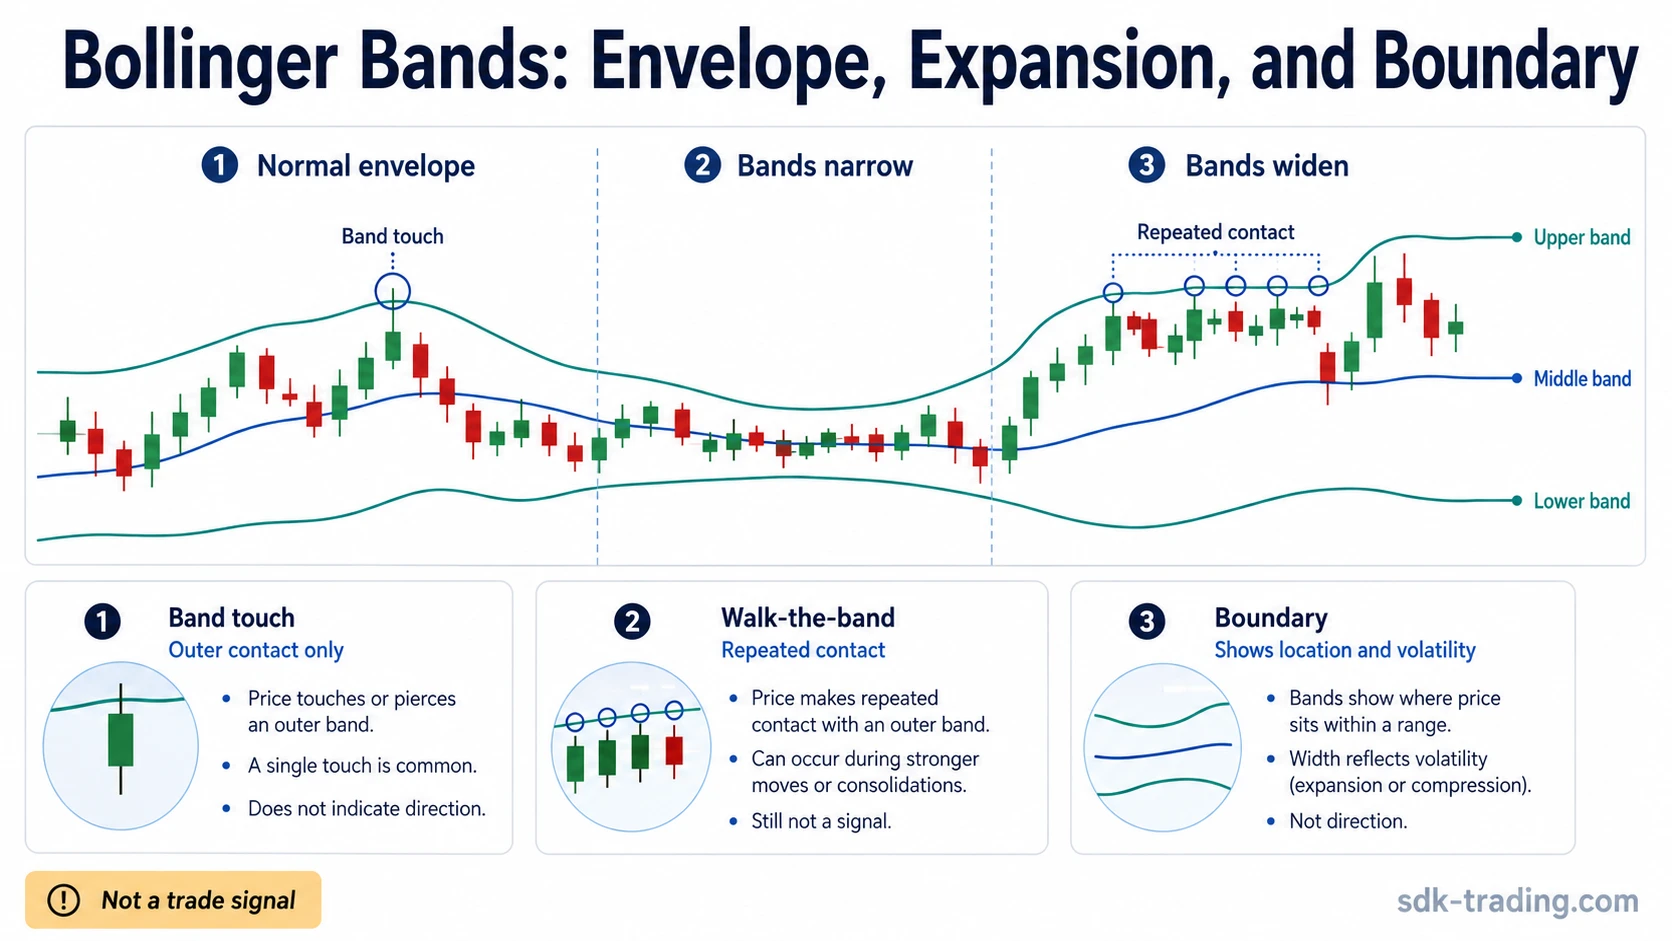
Band Touch vs Walk-the-Band Behavior
A band touch occurs when price reaches or exceeds one of the outer bands. The common mistake is treating that contact as a reversal signal. A touch only says that price has reached an outer part of the recent envelope.
Walk-the-band behavior occurs when price keeps pressing along an outer band during a strong move. In that condition, repeated upper-band contact can reflect persistent upside pressure, and repeated lower-band contact can reflect persistent downside pressure. The band contact is still not a trade instruction. It only shows that price remains extended while the structure continues to accept that extension.
For example, price may touch the upper band after a strong advance. That touch alone does not prove that price must reverse. If later candles continue closing near the upper side of the envelope and the middle band rises beneath them, the market may be walking the band rather than rejecting the extension.
Common Misreadings of Bollinger Bands
The most dangerous misreading is turning the upper band into a sell label and the lower band into a buy label. Outer-band contact can be useful information, but it needs surrounding structure. The same contact can mean pressure, extension, exhaustion, continuation, or a temporary overshoot depending on what happens next.
A second misreading is treating a squeeze as directional. A squeeze shows compression. It does not identify the direction of the next expansion. Directional interpretation needs evidence outside the narrow-band condition, such as acceptance beyond a range, failed follow-through, or a broader market-structure shift.
A third misreading is assuming that wider bands are bullish or bearish. Wider bands show a change in dispersion. That expansion can happen during upward movement, downward movement, or unstable two-sided volatility. The direction must come from price behavior, not from band width alone.
Diagnostic Boundary Table
| Observation | What it can show | What it does not prove |
|---|---|---|
| Bands widening | Dispersion is increasing around the moving average. | It does not prove bullish or bearish direction. |
| Bands narrowing | Dispersion is falling and price is more compressed. | It does not identify the next expansion direction. |
| Price touching the upper band | Price is high relative to the recent average and dispersion range. | It does not automatically mean price must reverse lower. |
| Price touching the lower band | Price is low relative to the recent average and dispersion range. | It does not automatically mean price must reverse higher. |
| Repeated outer-band contact | The market may be accepting extension along one side of the envelope. | It does not confirm that continuation will persist. |
| Squeeze after compression | Volatility has contracted and later expansion may become more noticeable. | It does not define the direction, timing, or quality of the move. |
How Bollinger Bands Differ From Related Volatility Tools
Bollinger Bands combine a moving average with standard deviation-based outer bands. Standard deviation is the dispersion input, while Bollinger Bands turn that input into a price envelope. They are related, but they are not the same object.
ATR is also a volatility tool, but it measures range-based movement rather than dispersion around a moving average. That difference matters when gaps, true range, and candle-to-candle distance are more important than price location around a mean.
Bollinger Band Squeeze, Bollinger Bandwidth, Bollinger %B, and settings analysis are closely related concepts. The main Bollinger Bands reading remains the envelope itself: middle band, upper band, lower band, expansion, contraction, and relative price location.
Practical Reading Checklist
A cleaner Bollinger Bands reading starts with the current band state. Are the bands widening, narrowing, or staying relatively stable? That answer defines the volatility backdrop before any outer-band contact is interpreted.
Next, compare price location with the middle band and outer bands. Price near an outer band means extension relative to the recent average and dispersion range. Price near the middle band means price is closer to the moving-average reference.
Then separate one-time contact from repeated acceptance. A single wick beyond a band can fail quickly. Repeated closes near an outer band can show that the market is accepting extension for longer. The reading weakens when price fails to hold outside the envelope or quickly returns toward the middle band without follow-through.
Finally, avoid treating the indicator as a decision engine. Bollinger Bands are most useful as a volatility and relative-location framework. They become weaker when they are used as isolated reversal, continuation, or timing signals.
FAQ
What are Bollinger Bands?
Bollinger Bands are a moving-average envelope with upper and lower bands based on standard deviation. They show relative price location and volatility expansion or contraction.
What is the default Bollinger Bands setting?
A common default is a 20-period moving average with bands placed 2 standard deviations above and below it. The default is not universally correct for every market or timeframe.
Does touching the upper or lower band mean price will reverse?
No. A band touch shows extension relative to the recent average and dispersion range. Price can reverse, stall, or continue walking the band.
What does a Bollinger Band squeeze mean?
A squeeze means the bands have narrowed as volatility contracted. It does not define the direction of the next expansion by itself.
Are Bollinger Bands the same as standard deviation?
No. Standard deviation is the dispersion input used to place the outer bands. Bollinger Bands turn that input into a moving price envelope.