Changing Bollinger Bands settings changes the measurement envelope around price, not the meaning of price by itself. The common default is a 20-period moving average with bands plotted 2 standard deviations above and below that average, but those settings do not confirm direction, reversal quality, timing, or the quality of a market reading on their own.
The useful question is not whether one setting is universally right. It is what each setting changes, what it makes more or less sensitive, and where that sensitivity can be misread.
What Bollinger Bands settings control
Bollinger Bands settings usually control two main inputs: the moving average period and the standard deviation multiplier. The period decides how many recent candles or bars are included in the moving average calculation. The standard deviation multiplier decides how far the upper and lower bands sit from that average.
In the standard Bollinger Bands structure, a middle band, upper band, and lower band form a volatility envelope around price. Settings change that envelope by changing the lookback window and the distance of the bands from the moving average.
A concise calculation view is:
- Upper band = moving average + multiplier x standard deviation
- Lower band = moving average – multiplier x standard deviation
That formula helps explain why the bands expand when recent movement becomes larger and contract when recent movement becomes smaller. It does not make a band touch meaningful by itself.
Default Bollinger Bands settings
The most common Bollinger Bands default is:
- 20-period moving average
- 2 standard deviations above and below the moving average
These defaults are common because they give a balanced baseline: not extremely fast, not extremely slow, not extremely narrow, and not extremely wide. They are still only measurement settings. A default setting does not prove that a market is stretched, ready to reverse, or ready to continue.
Some charting platforms allow the moving average type to be changed as well. That can alter the middle band’s responsiveness, but period length and standard deviation multiplier are usually the main settings to understand first.
Period length vs standard deviation multiplier
The period and multiplier are often adjusted together, but they do different jobs. The period changes the lookback window. The multiplier changes the distance between the moving average and the outer bands.
| Setting | What it changes | What it does not prove | Common misread |
|---|---|---|---|
| Period length | The lookback window and smoothing of the middle band | That a faster band is more accurate | Shorter settings feel more responsive, but they can also create more noise |
| Standard deviation multiplier | The distance of the upper and lower bands from the moving average | That fewer or more touches are automatically more useful | Narrower bands create more touches, which can be mistaken for stronger information |
| Band width / volatility response | How much the envelope expands or contracts as recent movement changes | That expansion or compression identifies direction by itself | A squeeze can be read as a forecast instead of a compression condition |
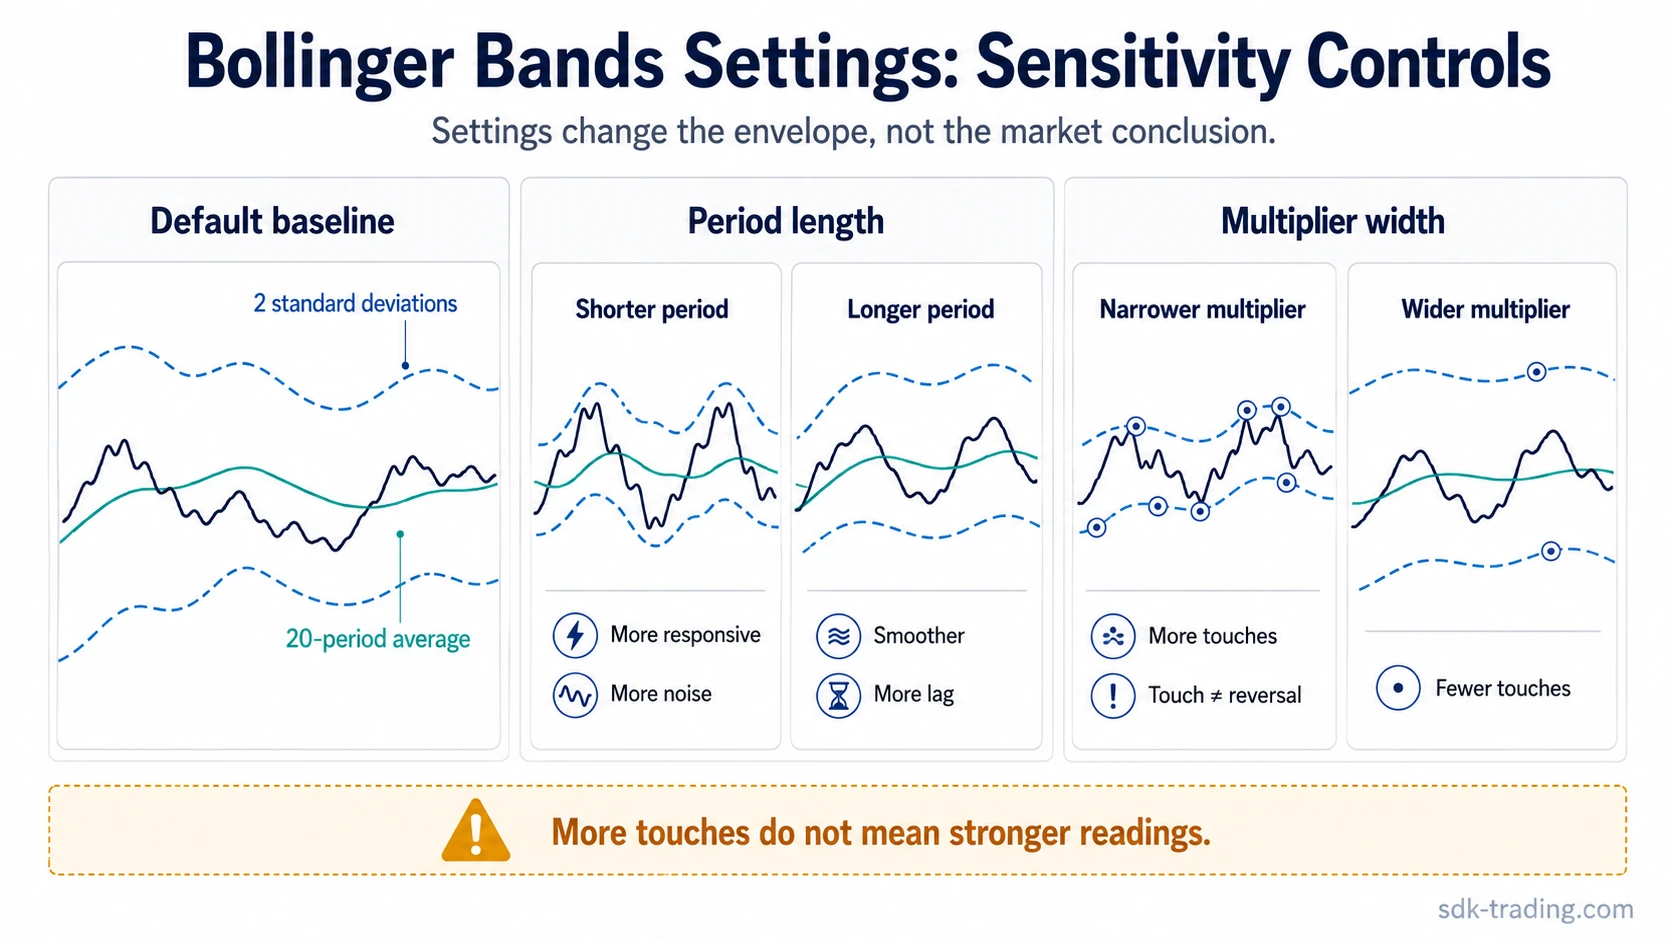
A shorter period makes the bands react more quickly to recent price movement. That can make changes easier to see, but it can also make the bands more sensitive to temporary movement.
A longer period smooths the bands because it uses more candles or bars in the calculation. That can reduce noise, but it also means the bands may react more slowly when volatility changes quickly.
How settings change sensitivity
Sensitivity is the main practical effect of Bollinger Bands settings. Shorter periods and narrower multipliers make the bands react more often. Longer periods and wider multipliers make the bands react less often.
For example, a shorter period can make the bands tighten or widen faster after a burst of movement. That does not mean the shorter setting is better. It means the measurement is more responsive and may produce more short-lived band touches.
A narrower standard deviation multiplier brings the upper and lower bands closer to price. This increases the number of times price touches or moves outside the bands. The mistake is treating more touches as more useful information, when the setting itself created a more sensitive envelope.
A wider multiplier pushes the bands farther away from the moving average. This usually reduces the number of touches, but it can also hide smaller changes in recent volatility. Wider does not mean safer or more reliable; it only changes the threshold needed for price to reach the bands.
Common false readings from Bollinger Bands settings
The main risk with Bollinger Bands settings is reading the band behavior as if it confirms price meaning by itself. The settings define the envelope. They do not decide whether price is reversing, continuing, or forming a reliable market conclusion.
| Situation | Common misread | Safer interpretation |
|---|---|---|
| Band touch | Price must reverse because it reached an outer band | A touch only shows price reached the current volatility envelope; price can continue along or outside the band |
| Band squeeze | Compression predicts the next direction | A squeeze shows lower recent volatility; direction still requires separate evidence |
| Walk-the-band behavior | Price near the band must be immediately overextended | Persistent trend behavior can keep price near an outer band for longer than expected |
| Settings adjustment | Changing inputs creates a better reading automatically | Changing inputs only changes sensitivity, smoothing, and touch frequency |
A band touch is one of the easiest readings to misuse. If the multiplier is narrow, touches become more frequent. If the period is short, the bands can react quickly and create more apparent extremes. In both cases, the setting may be shaping the observation more than the market condition itself.
A squeeze is also easy to overread. Narrow bands show that recent movement has compressed, but compression does not identify the direction of the next expansion. It only shows that the envelope has contracted around price.
Walk-the-band behavior creates the opposite problem. Price can remain near an upper or lower band during persistent movement. Reading every outer-band touch as immediate exhaustion can make the bands appear wrong when the actual issue is the interpretation.
Bollinger Bands settings vs Bollinger BandWidth
Bollinger Bands settings define how the bands are calculated. BandWidth is different: it is used to measure how wide or narrow the bands are relative to the middle band.
When the question is specifically about compression, the Bollinger BandWidth indicator is usually the cleaner measurement route. It focuses on the width of the bands instead of turning a visual squeeze into a directional assumption.
This distinction matters because settings and measurement answer different questions. Settings define the inputs. BandWidth helps describe the amount of compression or expansion. Neither one confirms the quality of a market reading by itself.
Settings reading checklist
- A shorter period may react faster, but noise can increase.
- A longer period may smooth more, but reaction can lag.
- A narrower multiplier may create more touches, but that does not make each touch more meaningful.
- A squeeze shows compressed recent movement, not a confirmed direction.
The safer reading is to treat settings as measurement controls. They shape what the bands display. They do not convert a touch, squeeze, or outer-band movement into a complete market conclusion.
FAQ
What are the default Bollinger Bands settings?
The common default is a 20-period moving average with upper and lower bands set 2 standard deviations from that average.
Are 20 and 2 always the right Bollinger Bands settings?
No. They are common defaults, not universal settings. Different settings change sensitivity, smoothing, and band-touch frequency, but they do not automatically improve interpretation.
What happens if the Bollinger Bands period is shorter?
A shorter period usually makes the bands react faster to recent movement. That can increase responsiveness, but it can also increase noisy touches and short-lived changes.
What happens if the standard deviation multiplier is wider?
A wider multiplier places the upper and lower bands farther from the moving average. This usually reduces band touches, but it can also make smaller volatility changes less visible.
Does a Bollinger Band squeeze predict direction?
No. A squeeze shows that the bands have narrowed because recent movement has compressed. It does not identify the direction of the next expansion by itself.