Single candlestick patterns are one-candle formations used in trading and technical analysis to classify real body size, wick behavior, open-close distance, close location, and the candle’s position inside recent price movement.
Definition: A single candlestick pattern is a chart formation where one candle carries the main visual information. The candle may show indecision, rejection, body control, exhaustion, range expansion, or a specific open-close relationship, but the category boundary is always one candle rather than a two-candle or three-candle sequence.
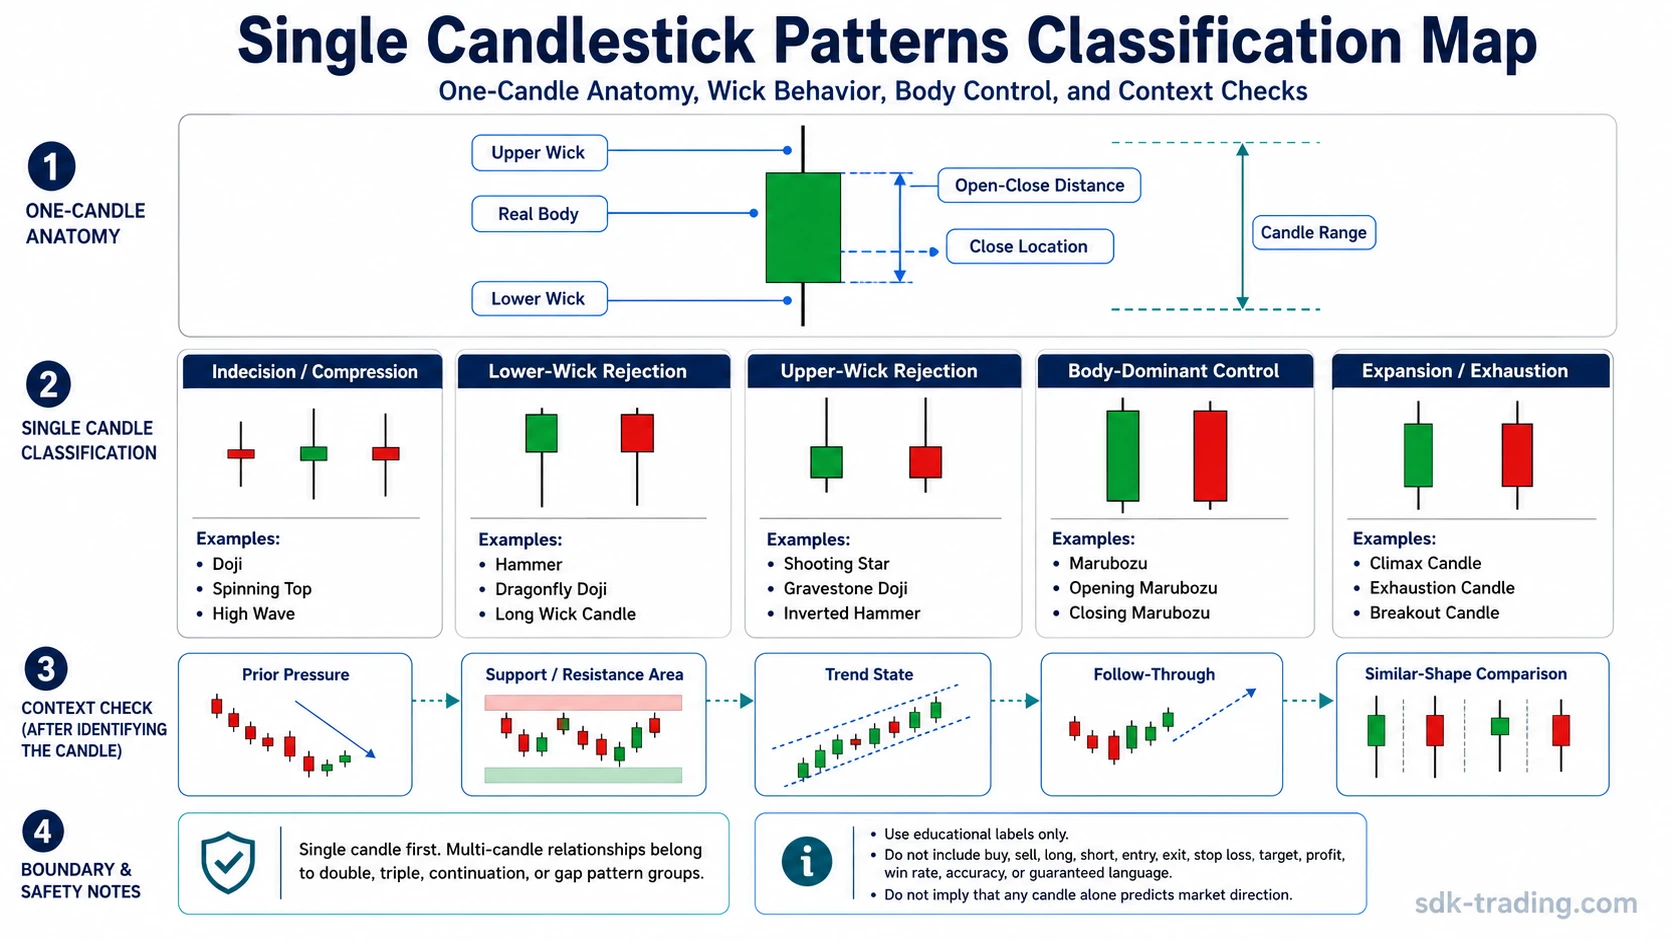
The category separates one-candle structures from double candlestick patterns, triple candlestick patterns, continuation formations, and gap-based candlestick patterns. The practical starting point is the candle itself: body size, wick length, open-close distance, and the close position inside the candle range.
Key Points
- Single candlestick patterns are classified by one candle’s body, shadows, open, close, and position inside the recent price move.
- The same one-candle shape can read differently when it appears after pressure, inside a range, near support or resistance, or during a trend.
- Doji, hammer, marubozu, pin bar, rejection candle, long wick candle, and spinning top all belong to the one-candle family.
- Visually similar candles need comparison when body size, wick direction, or prior pressure changes the interpretation.
How to Identify a Single Candlestick Pattern
A single candlestick pattern starts with one candle, so the first check is visual anatomy rather than a multi-candle sequence. The candle should be read by what it shows inside its own range before context is added.
| Check | What it shows | Why it matters |
|---|---|---|
| Real body size | The distance between open and close | Separates compressed candles from body-dominant candles. |
| Upper wick | Price movement above the body | Shows whether upper-side rejection or failed acceptance is part of the candle. |
| Lower wick | Price movement below the body | Shows whether lower-side rejection or failed downside extension is part of the candle. |
| Open-close distance | How compressed or directional the candle is | Helps separate doji-family candles from spinning tops, marubozu candles, and rejection candles. |
| Close location | Where the candle finishes inside its full range | Shows whether the candle closed near an extreme, near the middle, or away from the strongest wick. |
| Chart location | Where the candle appears in the recent move | Prevents similar shapes from being read the same way in different market conditions. |
Core Single Candlestick Pattern Groups
Single candlestick patterns are easier to classify when they are grouped by the visual evidence inside the candle. Some candles are defined by compression, some by wick rejection, some by body control, and some by expansion or exhaustion.
| Group | Main visual evidence | Examples |
|---|---|---|
| Indecision or compression candles | Small or compressed real body, often with visible shadows | Doji, spinning top, high wave candle |
| Lower-wick rejection candles | Long lower shadow with the body near the upper part of the candle | Hammer, dragonfly doji, long wick candle |
| Upper-wick rejection candles | Long upper shadow with the body away from the upper extreme | Shooting star, gravestone doji, inverted hammer |
| Body-dominant control candles | Large real body with little or no wick | Marubozu, opening marubozu, closing marubozu |
| Expansion or exhaustion candles | Large range, late pressure, or visible range expansion | Climax candle, exhaustion candle, breakout candle |
| Similar-shape comparison problems | Same or similar anatomy, different context or taxonomy | Hammer vs hanging man, inverted hammer vs shooting star, doji vs spinning top |
How to Choose the Right Single Candlestick Pattern
Use the candle’s visual job first. Some single candlestick patterns mainly show indecision. Others show directional pressure, failed continuation, strong body control, or wick rejection. The table separates the main one-candle structures by what the candle visibly shows.
| What the candle shows | Pattern to study | Single-candle boundary |
|---|---|---|
| Small or nearly absent open-close distance | Doji candlestick | Open-close compression is the main feature. |
| Long lower shadow with little or no upper shadow | Dragonfly doji | The lower shadow and close location define the candle. |
| Long upper shadow with little or no lower shadow | Gravestone doji | The upper shadow and close location define the candle. |
| Long shadows on both sides with open and close near the middle | Long-legged doji | The candle shows two-sided volatility inside one bar. |
| Small body with a long lower shadow after downside pressure | Hammer candlestick | The lower wick and body placement carry the main visual evidence. |
| Hammer-like anatomy after upside pressure | Hanging man candlestick | The same shape changes meaning when prior pressure changes. |
| Small body with a long upper shadow after downside pressure | Inverted hammer candlestick | The upper shadow is the main one-candle feature. |
| Upper wick after an advance or resistance test | Shooting star candlestick | The candle focuses on upper-side rejection. |
| Small real body with meaningful shadows on both sides | Spinning top candlestick | The body-shadow balance is the main feature. |
| Long body with little or no wick | Marubozu candlestick | The candle emphasizes body dominance rather than wick rejection. |
| Open near one extreme | Opening marubozu | The opening position is central to the structure. |
| Close near one extreme | Closing marubozu | The close location is central to the structure. |
Classify by Candle Anatomy
Single candle anatomy is the safest filter before interpretation. A long wick candle and a marubozu can both be large candles, but they carry different visual evidence. One emphasizes rejection or failed expansion; the other emphasizes body control and close location.
| Candle feature | Pattern to study | What to check first |
|---|---|---|
| Long upper or lower shadow | Long wick candle | Which side of the candle shows rejection and where the close finishes. |
| Strong rejection from one side of the candle | Rejection candle | Whether the wick shows failed acceptance beyond a price area. |
| Long rejection wick with a small body near one side of the candle | Pin bar | Whether the candle is being read as a broader price-action rejection structure rather than only a named candlestick variant. |
| Large range with pressure at an extreme | Climax candle | Whether the candle looks like pressure expansion rather than ordinary movement. |
| Large candle after a stretched move | Exhaustion candle | Whether expansion is happening late in the move rather than at the beginning. |
| Wide range and visible two-sided pressure | High wave candle | Whether the candle shows unstable auction behavior rather than clean direction. |
| Open near one extreme with directional body control | Belt hold candlestick | Whether the open and body structure dominate the single-candle reading. |
| Sharp shift from one candle’s open behavior | Kicker candlestick | Whether the pattern depends on abrupt repricing rather than ordinary wick behavior. |
| Single candle breaking beyond a prior area | Breakout candle | Whether the candle expands beyond a level without being reduced to a trade signal. |
Single, Double, and Triple Candlestick Pattern Boundaries
The word single defines the evidence unit. A single candlestick pattern uses one candle as the primary object. A double pattern requires a two-candle relationship, and a triple pattern requires a three-candle sequence. Mixing these boundaries makes the category less useful because the pattern can no longer be separated by anatomy, sequence, or surrounding structure.
| Pattern family | Evidence unit | Category boundary |
|---|---|---|
| Single candlestick patterns | One candle | Body size, wick length, open-close relationship, and candle location. |
| Double candlestick patterns | Two related candles | The second candle changes the evidence unit. |
| Triple candlestick patterns | Three-candle sequence | Sequence and order become the main evidence. |
| Gap candlestick patterns | Price gap plus candle behavior | The gap is the defining feature. |
Scope boundary: A single candlestick pattern starts with one candle. Once the analysis depends mainly on a second candle, a third candle, a gap, or a broader trend sequence, the structure belongs to a different candlestick category.
Common Single-Candle Confusions
Many single candlestick patterns look similar because they share body and wick features. The difference usually comes from where the candle appears, which side of the wick dominates, and whether the pattern is a doji-family candle, rejection candle, body-dominant candle, or comparison problem.
| Confusion | Comparison to study | What separates the concepts |
|---|---|---|
| Doji and spinning top both show hesitation. | Doji vs spinning top | Open-close compression versus small-body balance with more visible body range. |
| Dragonfly and gravestone doji are opposite doji variants. | Gravestone doji vs dragonfly doji | Upper-shadow rejection versus lower-shadow rejection. |
| Gravestone doji and shooting star can both have long upper shadows. | Gravestone doji vs shooting star | Doji-family open-close compression versus a small-body upper-shadow candle. |
| Hammer and hanging man often share the same visual shape. | Hammer vs hanging man | Similar anatomy, different prior pressure and interpretation path. |
| Hammer and pin bar overlap in wick-based rejection language. | Hammer vs pin bar | Candlestick-pattern taxonomy versus broader price-action rejection framing. |
| Inverted hammer and shooting star share an upper shadow. | Inverted hammer vs shooting star | Similar anatomy, different prior movement and pattern context. |
When a Single Candlestick Reading Needs More Context
A one-candle pattern is not the whole market story. Some questions move beyond the candle name and into location, trend state, or follow-through behavior. In that case, the same candle should be read through a narrower condition rather than treated as a complete conclusion by itself.
| Context question | Focused topic | Why the base candle is not enough |
|---|---|---|
| How does a doji behave near a known price area? | Doji at support or resistance | The issue is location-based interpretation, not the doji definition. |
| How does a doji behave inside an existing trend? | Doji in trend | The issue is trend-state reading, not the base candle anatomy. |
| How do single candles behave when the market is already trending? | Single candlestick patterns in trending markets | The issue is trend interaction across several one-candle structures. |
| How reliable is a closing marubozu reading? | Marubozu closing reliability | The issue is reliability filtering, not the base marubozu-closing definition. |
How to Read the Category
Start with the candle’s anatomy: body size, wick length, open-close distance, and close position. If the main question is what this candle is, the answer usually sits in the base pattern. If the question becomes how this candle behaves in a trend, near a level, or against a similar-looking candle, the analysis needs a narrower context or comparison.
This keeps the single candlestick category focused. One-candle structures stay separate from multi-candle sequences, while visually similar candles are compared only where the overlap can cause a real interpretation problem.