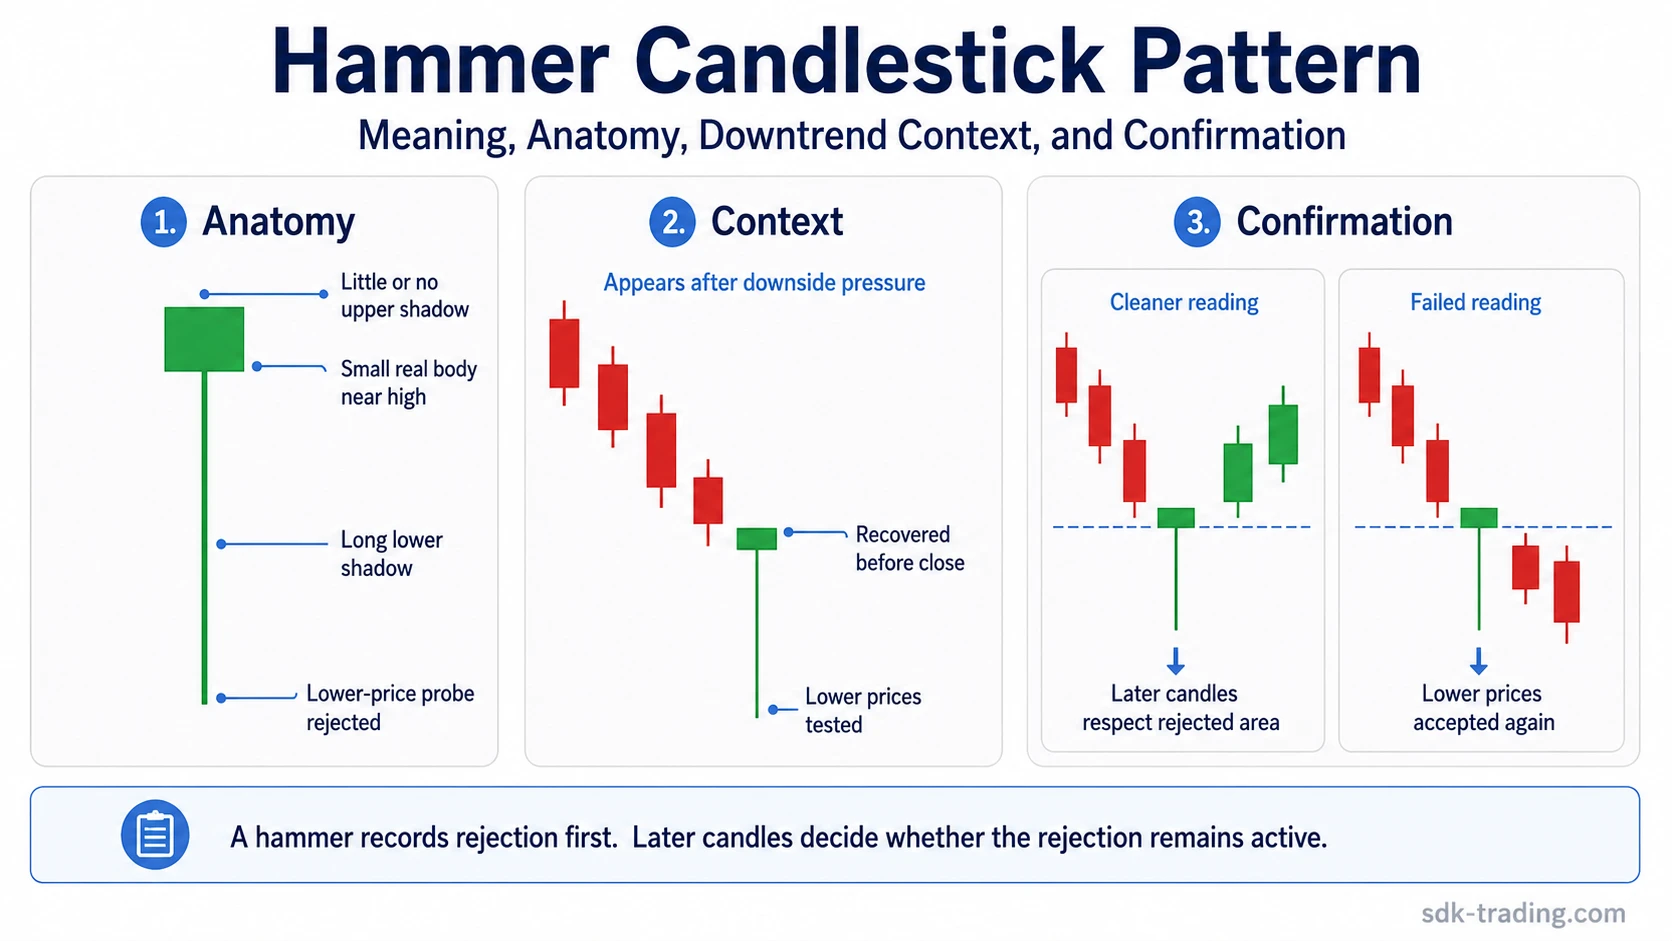
A hammer candlestick pattern is a single-candle bullish reversal pattern that appears after a downtrend or clear downside pressure. It has a small real body near the high of the candle, a long lower shadow, and little or no upper shadow. The structure shows that sellers pushed price lower, but lower prices were rejected before the candle closed.
A hammer candlestick records a rejected lower-price probe after selling pressure. The long lower shadow shows where price was pushed down. The small body near the high shows that the market recovered before the close. That can make the hammer useful as a warning of possible downside exhaustion, but the candle does not confirm a reversal by itself. Later candles decide whether the rejected lower area remains respected or fails.
Key Points
- A hammer candlestick has a small real body near the upper part of the candle range.
- The lower shadow is the dominant part of the structure and is often at least twice the size of the real body.
- Little or no upper shadow keeps the hammer reading cleaner.
- The pattern is most relevant after a downtrend, pullback, or clear downside pressure.
- A hammer is usually read as a bullish reversal pattern, but only when context and later confirmation support that reading.
- The hammer itself is not a buy signal, prediction, or completed market decision.
What Is a Hammer Candlestick?
A hammer candlestick forms when price moves lower during the candle and then recovers enough to finish near the upper end of the range. The lower shadow shows the attempted downside move. The small body near the high shows that the market did not keep accepting those lower prices into the close.
In classical candlestick analysis, the hammer is usually described as a bullish reversal pattern after a decline. The bullish label should not be read mechanically. The candle shows rejection of lower prices, not guaranteed upward continuation. The bullish reading becomes stronger only when later candles hold above the rejected lower area.
Context is part of the label. A hammer reading is normally tied to prior downside pressure, a pullback, or a test of lower prices. The same lower-shadow shape in a different setting may deserve a different interpretation, especially if it appears after an advance or inside directionless range noise.
Hammer Candle Anatomy
| Structure element | What to check | What it records | What it does not prove |
|---|---|---|---|
| Small real body | The open and close are close together compared with the full candle range. | The candle finished with compressed open-close distance near the upper area. | A small body alone does not make a hammer. |
| Body near the high | The real body sits close to the session high rather than near the middle or low. | The lower-price probe did not remain accepted by the close. | A body near the lower half weakens or breaks the hammer reading. |
| Long lower shadow | The lower shadow clearly dominates the candle and is often at least twice the size of the real body. | Sellers tested lower prices before the market recovered. | A long lower wick alone is not enough if the body position is wrong. |
| Little or no upper shadow | The candle has minimal extension above the real body. | The close stayed near the upper portion of the candle range. | A large upper shadow creates a more mixed reading. |
| Prior downside pressure | The candle appears after selling pressure, a pullback, or a lower-price test. | The rejection has a context where downside failure may matter. | The same shape in another context may not be a useful hammer reading. |
| Later response | Subsequent candles either respect the lower rejection area or accept lower prices again. | The market confirms, weakens, or invalidates the initial rejection attempt. | The hammer itself does not decide the full outcome. |
Common mistake: Calling every lower wick a hammer.
A lower wick is only one part of the structure. The candle also needs a small body near the high, a dominant lower shadow, little or no upper shadow, and a context where rejected lower prices are meaningful.
What Does a Hammer Candlestick Mean?
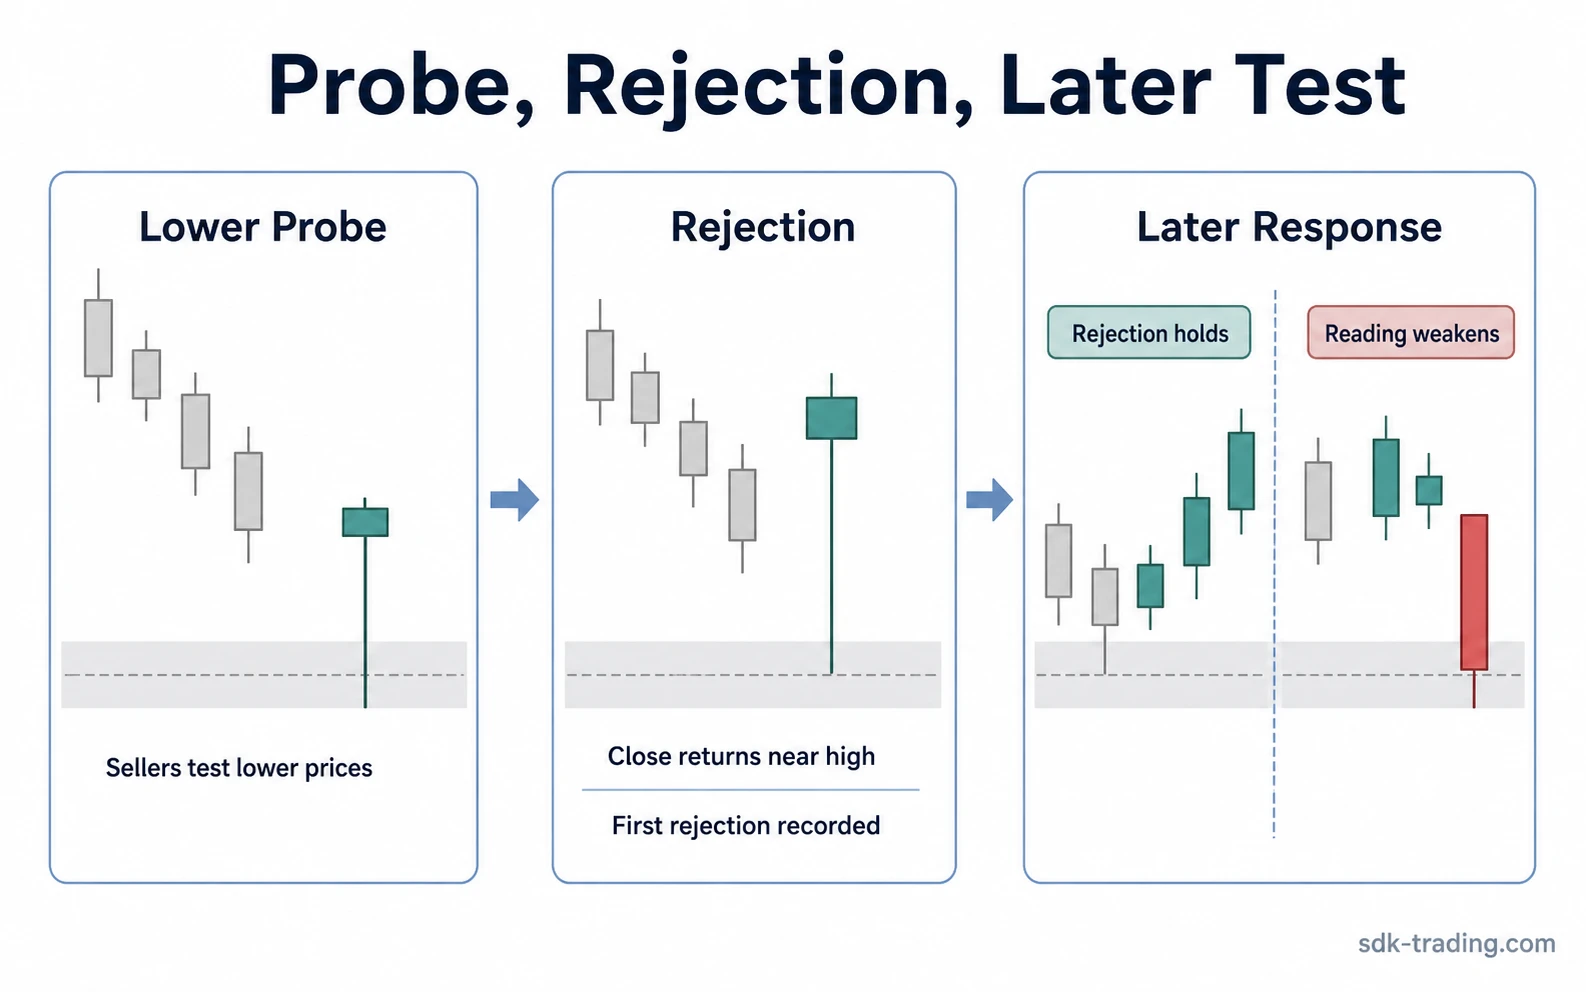
A hammer candlestick means that lower prices were tested and then rejected before the candle closed. Sellers controlled part of the session, but they did not keep control into the close. That is why the hammer is usually read as a possible shift in pressure after a decline.
The useful message is not that price must reverse. The useful message is that the market rejected a lower-price probe. If later candles continue to hold above that rejected area, the hammer reading becomes stronger. If later candles move back below it, the rejection has failed.
This makes the hammer more useful as a diagnostic structure than as a standalone trading signal. It can show where selling pressure met a response, but it still needs context, location, and follow-through.
Is a Hammer Candlestick Bullish?
A hammer candlestick is usually considered bullish only when it appears after downside pressure. In that setting, the candle can suggest that sellers tested lower prices but failed to keep price down into the close.
The candle is not automatically bullish in every location. A hammer-like candle inside random sideways movement may only show intraperiod volatility. A similar shape after an advance may be closer to a hanging man reading because the surrounding context changes the message.
The bullish interpretation becomes cleaner when the hammer forms after a decline, near a meaningful reaction area, and is followed by candles that avoid accepting lower prices again.
Does Hammer Candle Color Matter?
A hammer can be green or red. A green hammer closes above its open, which usually makes the recovery inside the candle look cleaner. A red hammer closes below its open, but it can still be a hammer if the body is small, the lower shadow dominates, and the close remains near the upper part of the range.
Candle color should not override structure. A green body does not make a weak hammer strong, and a red body does not automatically invalidate a clean hammer. Body location, lower-shadow dominance, prior downside pressure, and later response carry more weight than color alone.
| Hammer color | What it can suggest | What still matters more |
|---|---|---|
| Green hammer | The candle closed above its open after recovering from lower prices. | Context, lower-shadow dominance, and follow-through. |
| Red hammer | The candle closed below its open but still rejected the lower probe into the close. | Whether the body remains small and near the high. |
| Any hammer color | The lower-price probe was rejected during the candle. | Whether later candles confirm or fail that rejection. |
How to Identify a Hammer Without Overreading It
Start with context before the candle shape. A hammer is easier to interpret when it follows downside pressure. Without that prior pressure, the same candle may only show intraperiod volatility rather than a meaningful rejection of lower prices.
| Check | Cleaner hammer reading | Weaker or invalid reading |
|---|---|---|
| Prior movement | Price has been declining, pulling back, or testing lower levels. | The candle appears in random sideways movement with no useful downside context. |
| Body position | The real body is near the upper part of the candle range. | The body sits near the middle or lower part of the candle. |
| Lower shadow | The lower shadow clearly dominates the candle and is often at least twice the body size. | The lower shadow is only slightly larger than the body. |
| Upper shadow | There is little or no upper shadow. | A large upper shadow makes the candle more indecisive. |
| Follow-through | Later candles avoid accepting lower prices again. | Later candles move back below the tested area and treat the rejection as failed. |
This process keeps the hammer label useful. It prevents the reading from becoming a shortcut where any long lower wick is treated as meaningful regardless of structure, location, or later response.
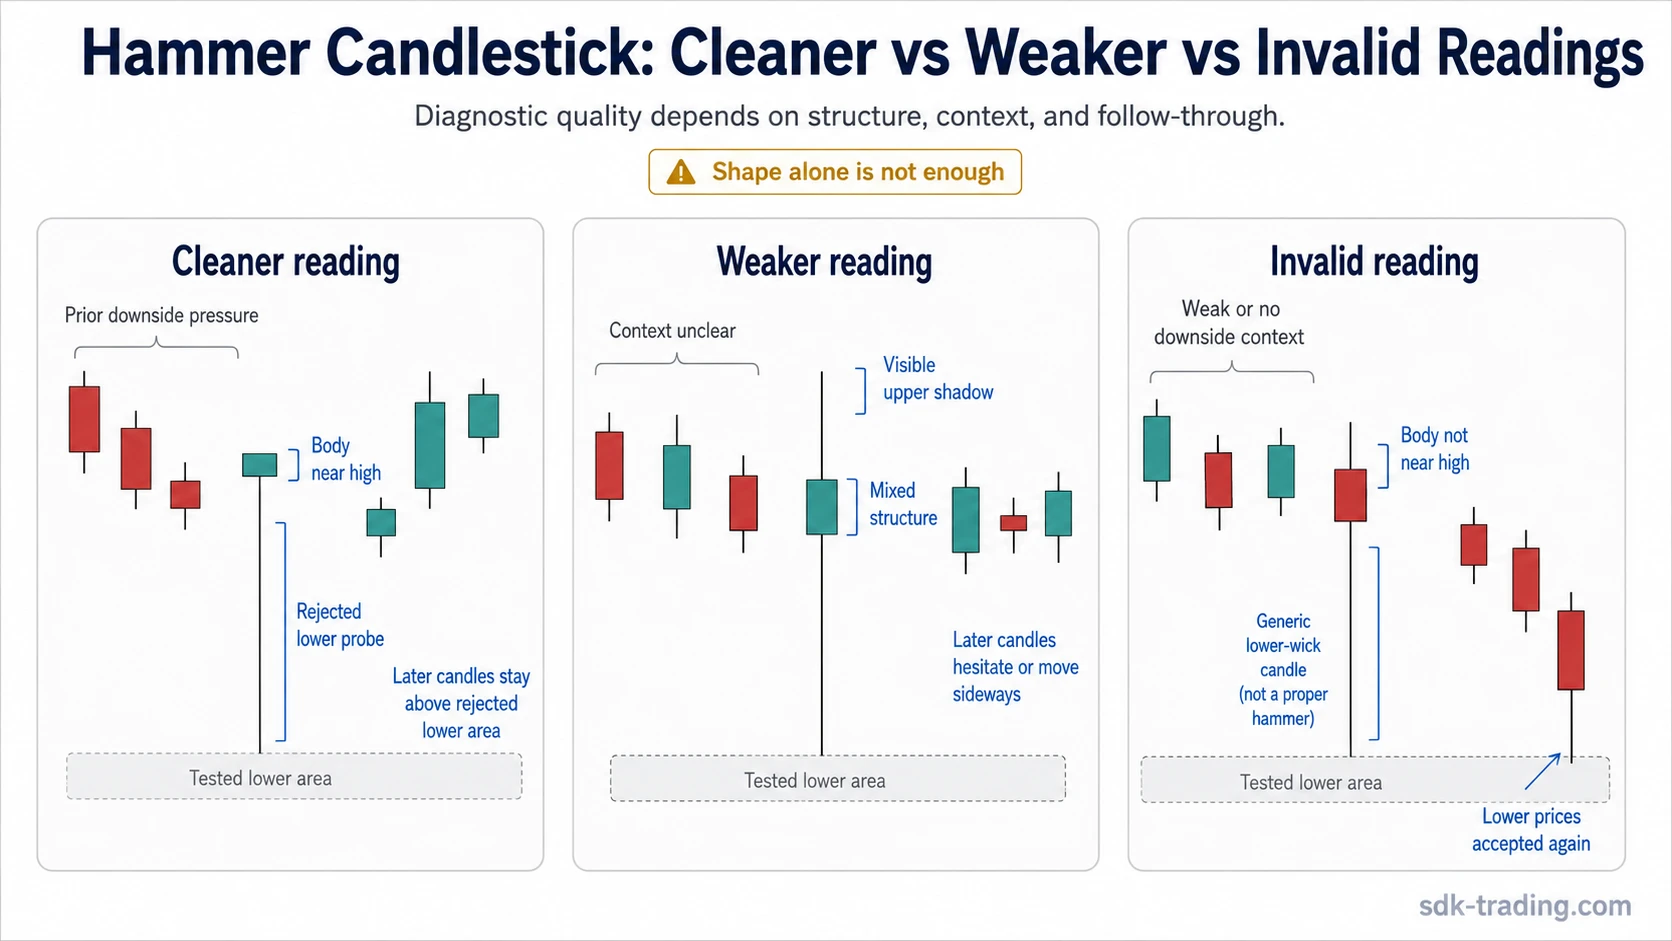
Hammer Candlestick Examples: Clean, Weak, and Invalid Readings
A hammer can look correct at first glance while still producing a weak diagnostic reading. The difference comes from how much of the structure is clean and whether later candles respect the rejected lower area.
| Reading quality | What it looks like | How to interpret it safely |
|---|---|---|
| Clean hammer | Prior downside pressure, small body near the high, dominant lower shadow, little or no upper shadow, and later candles that avoid deeper downside acceptance. | The lower-price probe was rejected and the rejection remains active unless later price action breaks it. |
| Weak hammer | The candle has a lower shadow, but the body is not very close to the high, the upper shadow is visible, or the context is unclear. | The candle may show hesitation after selling pressure, but the structure is not clean enough to read strongly on its own. |
| Invalid or failed reading | Later candles accept lower prices again, the body is too low in the range, or the candle appears without meaningful downside context. | The market did not maintain the rejection message. The hammer label should not be used as if the rejection remained intact. |
Hammer Confirmation and Failed Acceptance
The safest way to think about hammer confirmation is not as a mechanical trigger. Confirmation means the market continues to respect the area where lower prices were rejected. Failed acceptance means later candles move back into or below that lower area and show that the rejection did not hold.
The hammer candlestick confirmation check focuses on how later candles can support, weaken, or cancel the original rejection reading.
| Later behavior | What it suggests | Why it matters |
|---|---|---|
| Price stays above the rejected lower area | The hammer rejection remains active. | The market has not accepted the lower-price probe again. |
| Price moves sideways above the low | The reading remains unresolved. | The candle warned of rejection, but later candles have not added strong evidence. |
| Price moves back through the lower area | The hammer reading weakens or fails. | The market is accepting prices that the hammer initially rejected. |
Hammer in a Downtrend or Near Support
A hammer is usually more meaningful when it appears after downside pressure because the candle is then responding to an existing selling sequence. In that setting, the lower shadow shows an attempt to continue lower, while the close near the high shows that the attempt was rejected during the candle.
The hammer in downtrend page focuses on why prior pressure changes the reading. A downtrend context does not guarantee a reversal, but it explains why a rejected lower probe may carry more diagnostic value than the same candle in random range noise.
A reaction area can also change how the hammer is read. When the lower shadow tests a level that previously attracted demand or slowed selling, the candle has a clearer diagnostic location. The hammer at support page covers that support-specific interpretation without turning this pattern into a trade setup.
Volume, Support, and Hammer Context
Volume does not validate a hammer by itself, but it can change how visible the rejection appears. A hammer that forms with stronger participation after a decline may show that the lower-price test attracted a more active response. A hammer that forms on weak participation may still be valid structurally, but it leaves more room for the candle to be random noise.
Support works in a similar way. A hammer near a relevant reaction area can be easier to interpret than a hammer in the middle of an undefined range. The level does not make the pattern certain. It only gives the rejected lower shadow a clearer location to test.
How Traders Use a Hammer Candlestick Safely
Traders often use a hammer candlestick as a context clue, not as a complete decision. The candle can mark a possible change in pressure after sellers tested lower prices, but it still needs confirmation from the surrounding structure.
| Step | What to check | Why it matters |
|---|---|---|
| 1. Check prior pressure | Look for a decline, pullback, or lower-price test before the hammer. | The hammer reading is strongest when it responds to actual selling pressure. |
| 2. Check proportions | Confirm a small body near the high, a long lower shadow, and little or no upper shadow. | Wrong anatomy weakens the label before any later interpretation begins. |
| 3. Check location | Look at whether the lower shadow tested a meaningful reaction area. | Location can make the rejected lower probe more useful to interpret. |
| 4. Check later candles | Watch whether later candles hold above the rejected lower area or accept lower prices again. | Follow-through separates active rejection from a failed reading. |
| 5. Reject weak readings | Do not treat a hammer as valid when context, anatomy, or follow-through contradicts it. | The pattern is a diagnostic structure, not permission to act. |
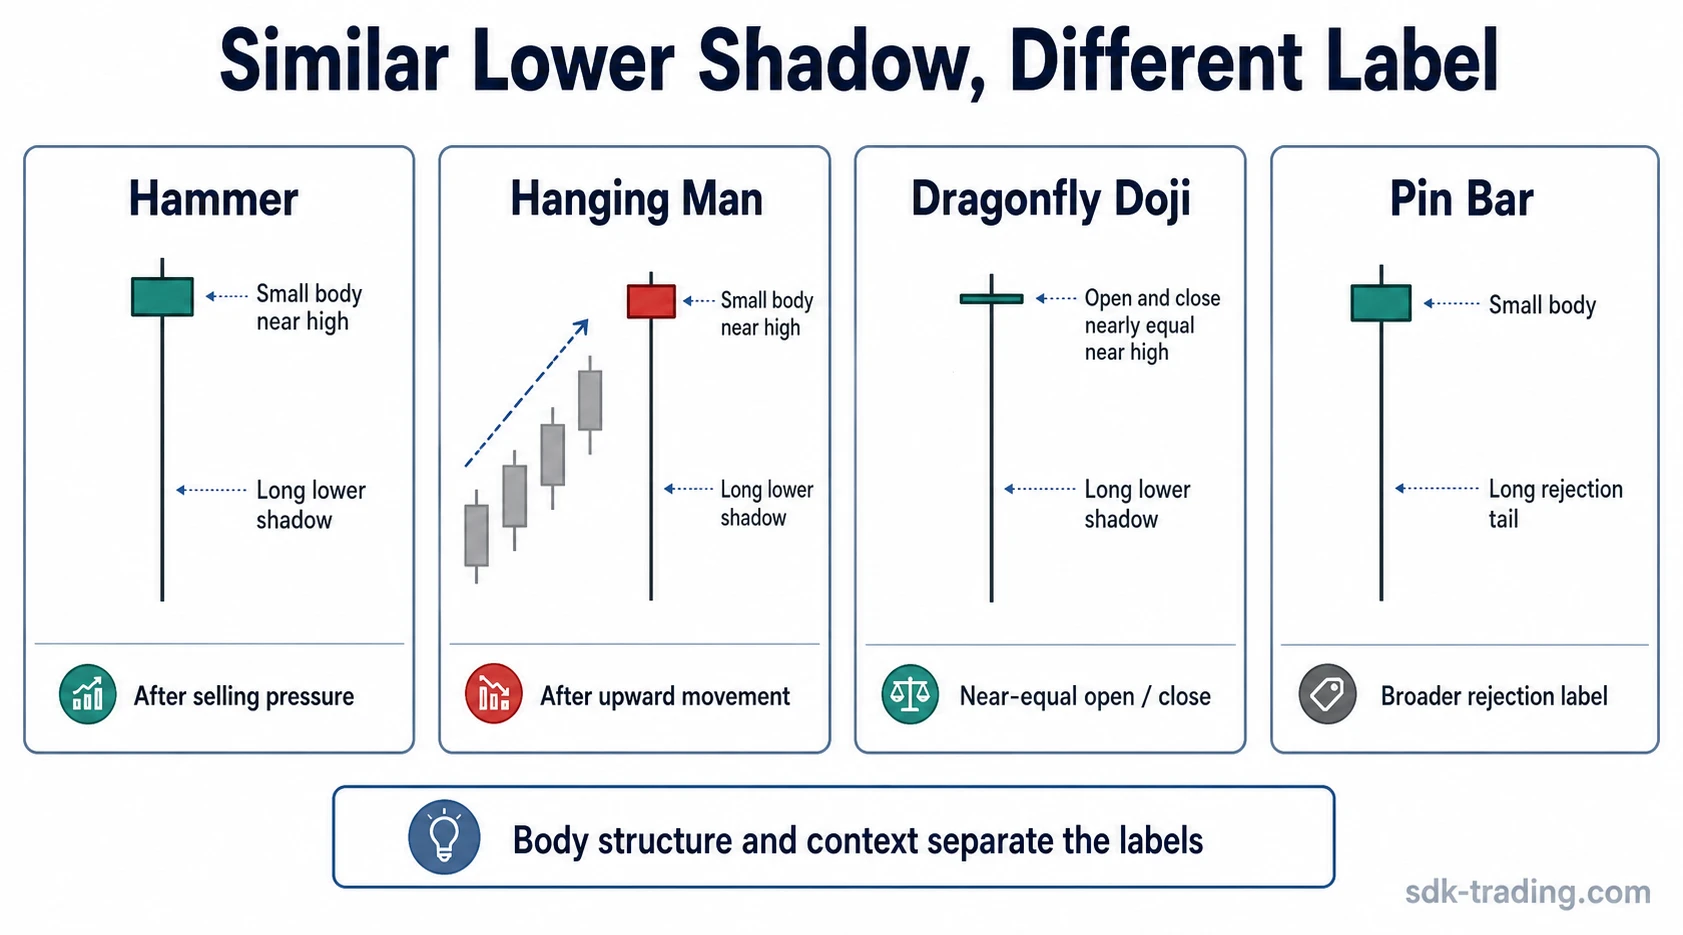
Hammer vs Similar Lower-Shadow Candles
Several candle structures can show a lower shadow, but they do not all carry the same meaning. The label changes when context, body structure, or the purpose of the candle changes.
| Pattern | Shared feature | Main difference from hammer | Diagnostic boundary |
|---|---|---|---|
| Hammer | Small body near the high and long lower shadow. | Appears after downside pressure and records rejected lower prices. | The lower probe must fail into the close. |
| Hanging man | Can have the same lower-shadow shape. | Appears after upward movement, not after downside pressure. | Same shape, different context. |
| Dragonfly doji | Long lower shadow and close near the high. | Open and close are nearly the same, creating a doji structure. | The body is compressed into a doji, not a normal small body. |
| Pin bar | Long rejection tail. | Pin bar is broader price-action language and may be defined by rejection behavior rather than the classical hammer label. | Hammer is the narrower candlestick-pattern label. |
| Generic long lower-wick candle | Visible lower extension. | May lack the correct body location, context, or follow-through. | Lower wick alone is not enough. |
The inverted hammer is a separate pattern because its dominant shadow is above the body, not below it. That changes the type of price probe being tested.
Where the Hammer Fits in Candlestick Pattern Reading
The hammer belongs to single-candle pattern reading because one candle contains the full visible structure: small body, long lower shadow, minimal upper shadow, and a close near the high. Its main role is to show a rejected lower-price probe after downside pressure.
For broader orientation, most popular candlestick patterns separates hammer readings from other common single, double, and multi-candle structures.
Common Hammer Candlestick Mistakes
| Mistake | Why It Weakens the Reading | Cleaner Interpretation |
|---|---|---|
| Reading the shape without body location | If the body sits near the middle or lower part of the candle, the rejection message is weaker. | A cleaner hammer closes near the upper end of the candle range. |
| Overlooking a large upper shadow | A long upper shadow shows that price tested higher levels but failed to hold near the upper part of the session range. | A cleaner hammer has little or no upper shadow. |
| Treating the candle as a complete decision | A hammer can warn that lower prices were rejected, but it does not confirm the next move by itself. | Later price action decides whether the warning remains useful. |
| Removing trend and location from the reading | The same candle shape can mean less when it appears inside random sideways movement. | A hammer is more meaningful after downside pressure or near a relevant reaction area. |
| Confusing a diagnostic candle with permission to act | The hammer is sometimes treated as an instruction instead of a structure to interpret. | The reading improves only when context, candle anatomy, and the next market response support the same interpretation. |
FAQ
What is a hammer candlestick pattern?
A hammer candlestick pattern is a single-candle bullish reversal pattern with a small body near the session high, a long lower shadow, and little or no upper shadow. It records a lower-price probe that failed to hold into the close.
What does a hammer candle mean?
A hammer candle means that sellers tested lower prices during the candle, but the market recovered before the close. The useful reading is rejected lower-price acceptance, not a guaranteed reversal.
Is a hammer candlestick bullish?
A hammer candlestick is usually read as bullish only after downside pressure or a downtrend. Without that context, the same candle shape may show volatility rather than a useful reversal warning.
What makes a hammer candlestick valid?
A cleaner hammer has prior downside pressure, a small body near the high, a dominant lower shadow often at least twice the body size, little or no upper shadow, and later candles that avoid accepting lower prices again.
When does a hammer reading fail?
A hammer reading fails or weakens when later candles move back into the rejected lower area and accept lower prices again. It can also be invalid if the body location, shadow structure, or prior context does not fit the pattern.
How is a hammer different from a hanging man?
A hammer and a hanging man can share a similar lower-shadow shape. The difference is context: a hammer is read after downside pressure, while a hanging man appears after upward movement.
How is a hammer different from an inverted hammer?
A hammer has the long shadow below the body. An inverted hammer has the long shadow above the body, so it records a different type of price probe.