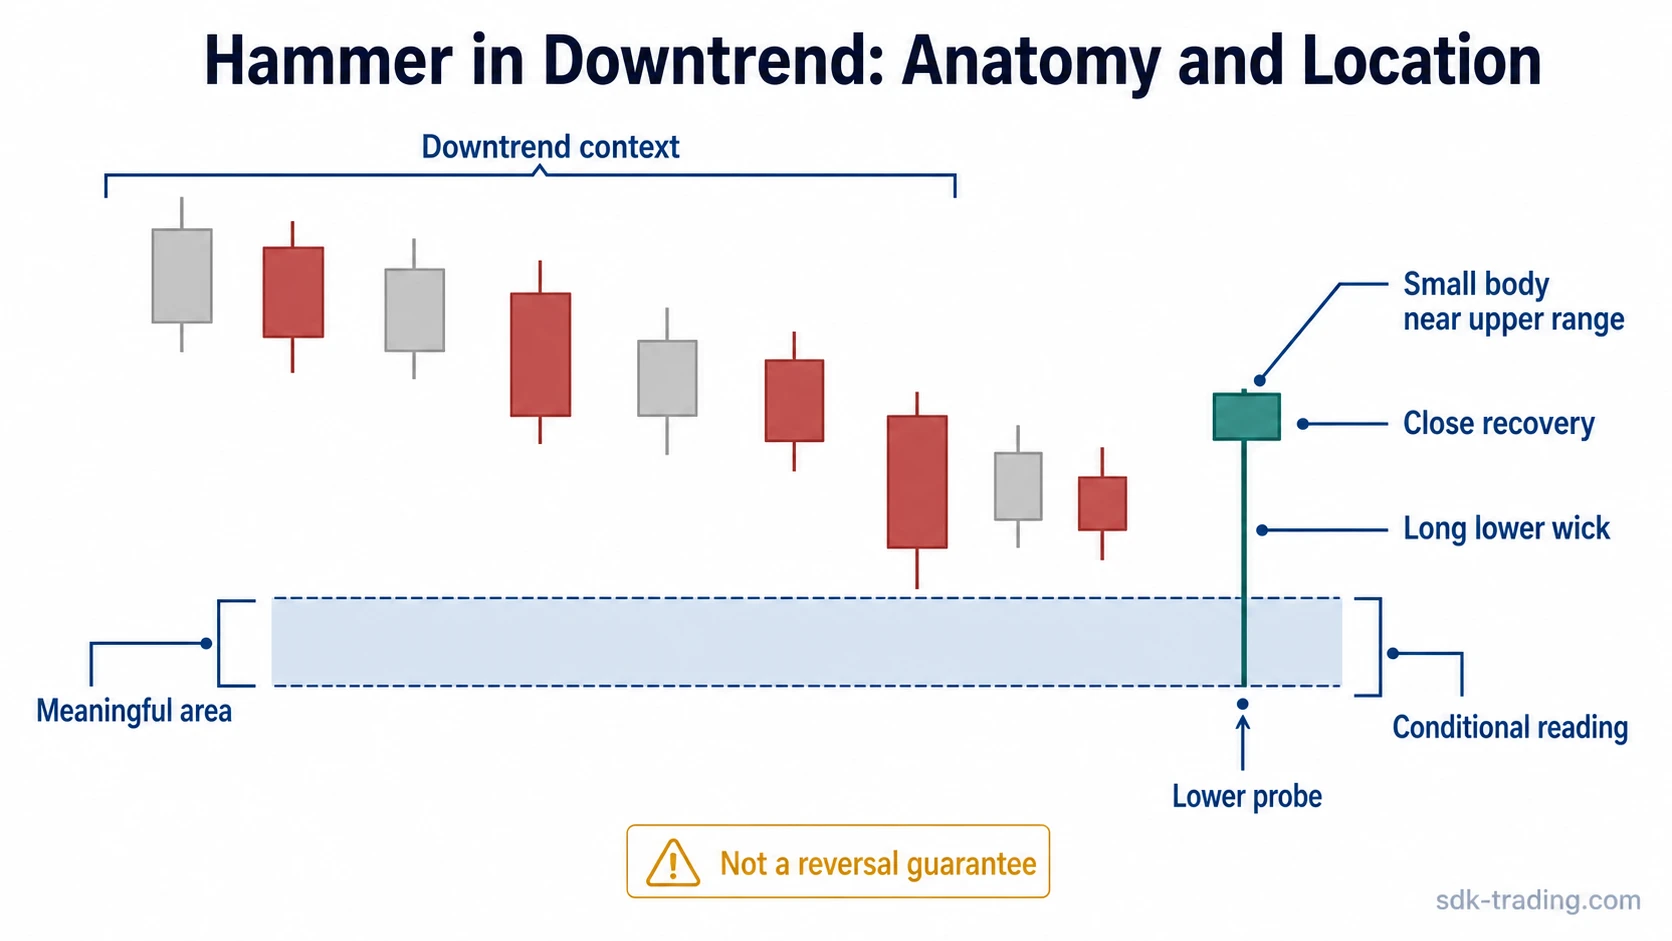
A hammer candlestick in a downtrend is not just any candle with a long lower wick during falling prices. The candle still needs hammer-like anatomy: a small real body near the upper part of the candle range, a long lower wick, and little or no upper wick. The more important question is whether that lower wick tested a meaningful area, recovered from the probe, and avoided acceptance below it.
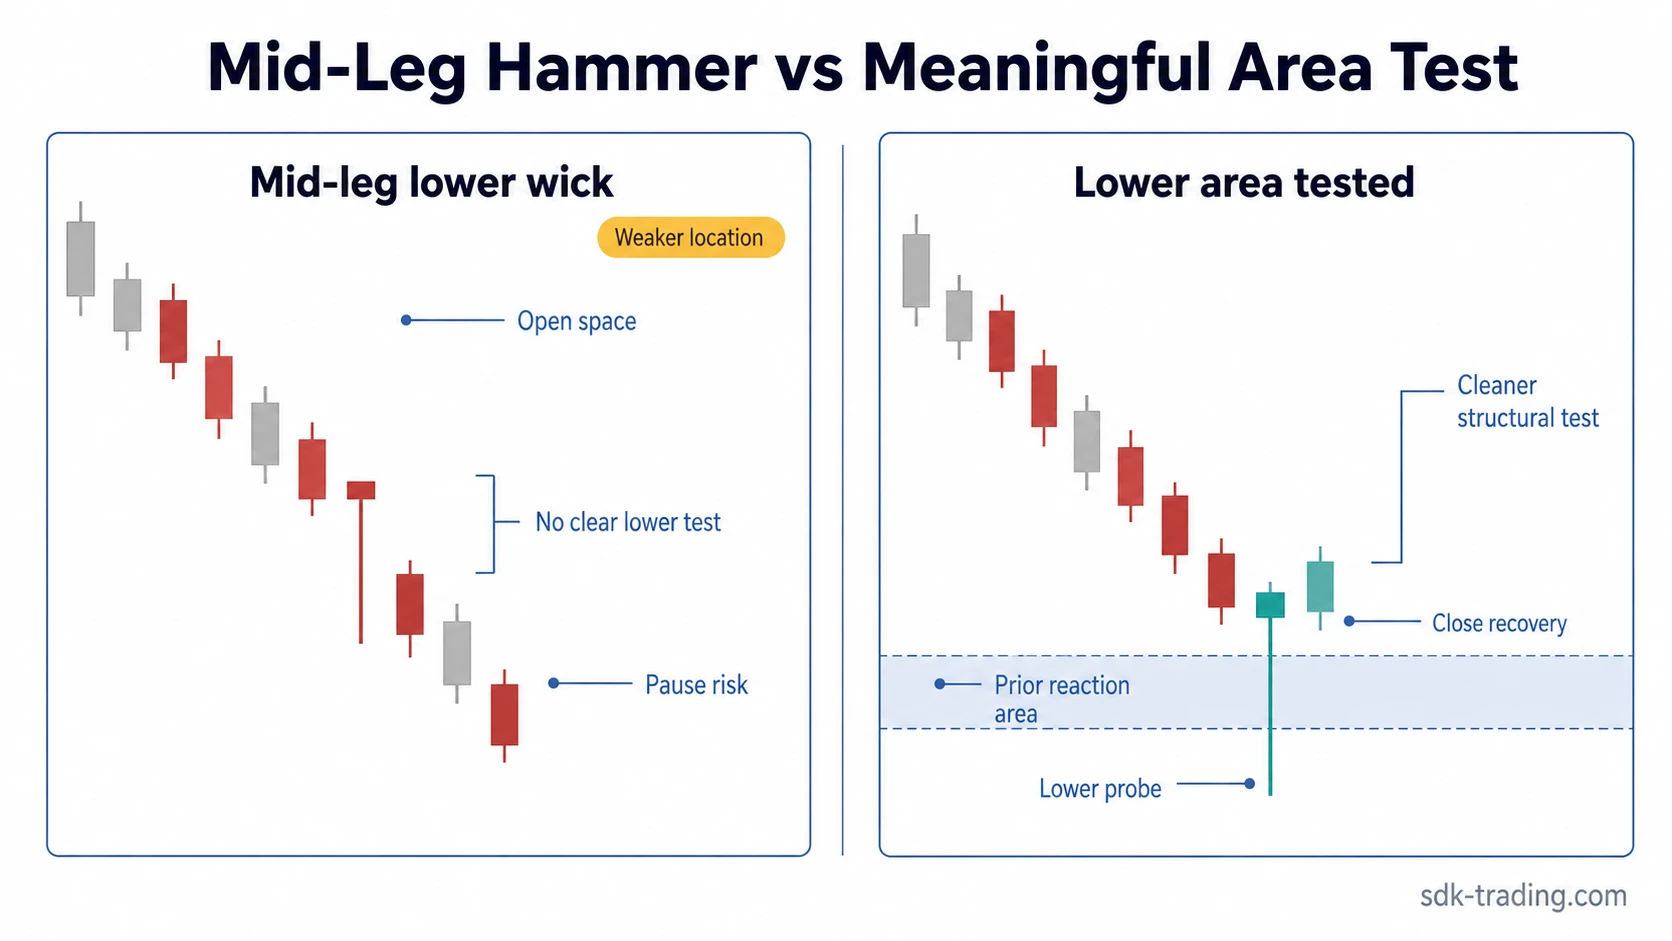
A lower wick that appears in the middle of a declining leg can be only a pause inside bearish structure. A more defensible reading develops when the lower probe interacts with a prior swing low, support area, demand zone, or failed breakdown area, then closes back above the area instead of accepting lower prices.
Key Points
- A hammer in a downtrend needs both candle anatomy and meaningful location.
- The downtrend supplies context, but it does not make every lower wick important.
- Both red and green hammer bodies can appear; close location and later response matter more than color alone.
- The continuation risk remains high when later candles accept below the hammer low.
What a Hammer in a Downtrend Means
A hammer in a downtrend is a hammer-shaped candle that appears after bearish movement and suggests that sellers pushed price lower but failed to retain the full lower move by the close.
The candle is a rejection structure, not a reversal guarantee. The lower wick records the probe. The small body near the upper part of the range records partial recovery. The downtrend explains why the candle attracts attention: it appears after pressure has already moved price lower.
The common mistake is treating the trend context as enough. A downtrend can contain many temporary lower-wick candles that do not change the structure. A safer interpretation asks whether the candle tested a meaningful price area, whether the close recovered enough of the range, and whether later candles reject or accept the lower prices.
Why Mid-Leg Hammers Are Weaker
A mid-leg hammer appears inside open space, away from a clear support area, prior swing low, failed breakdown, or other visible reference point. The candle may still show intraday or intra-period recovery, but the market has not necessarily tested an area where demand was previously expected to appear.
That difference matters because a hammer is easier to interpret when the lower wick has a clear job. If the wick probes below a prior low and closes back above it, the candle has tested whether lower prices could be accepted. If the wick appears in the middle of a decline with no nearby reference, the same shape may reflect temporary profit-taking, short-term volatility, or a brief pause before continuation.
Mid-leg hammers also create a false-positive problem. The eye sees a familiar shape and may treat it as reversal evidence before the market has shown any real shift in control. A cleaner case usually needs later candles to stop accepting lower prices, reclaim the lower area, or build a clearer reaction around the wick low.
Condition, Safer Reading, and Risk
| Condition | Safer reading | Main risk |
|---|---|---|
| Lower wick tests a prior swing low or support area | The candle has a clearer structural reference because the lower move tested an area where price previously reacted. | The test can still fail if later candles accept below the wick low. |
| Lower wick appears mid-leg inside a decline | The candle may show temporary recovery, but the location is weaker without a meaningful structural test. | Bearish continuation can resume after a short pause. |
| Red body with strong close recovery | A red body does not automatically invalidate the hammer if the candle still closes near the upper part of its range. | The close may still be too weak if it remains deep inside the lower part of the range. |
| Green body without a structural test | Color alone is not enough. A green body can improve the close profile, but location still controls the quality of the read. | The candle can be overread as bullish when it only reflects a minor bounce. |
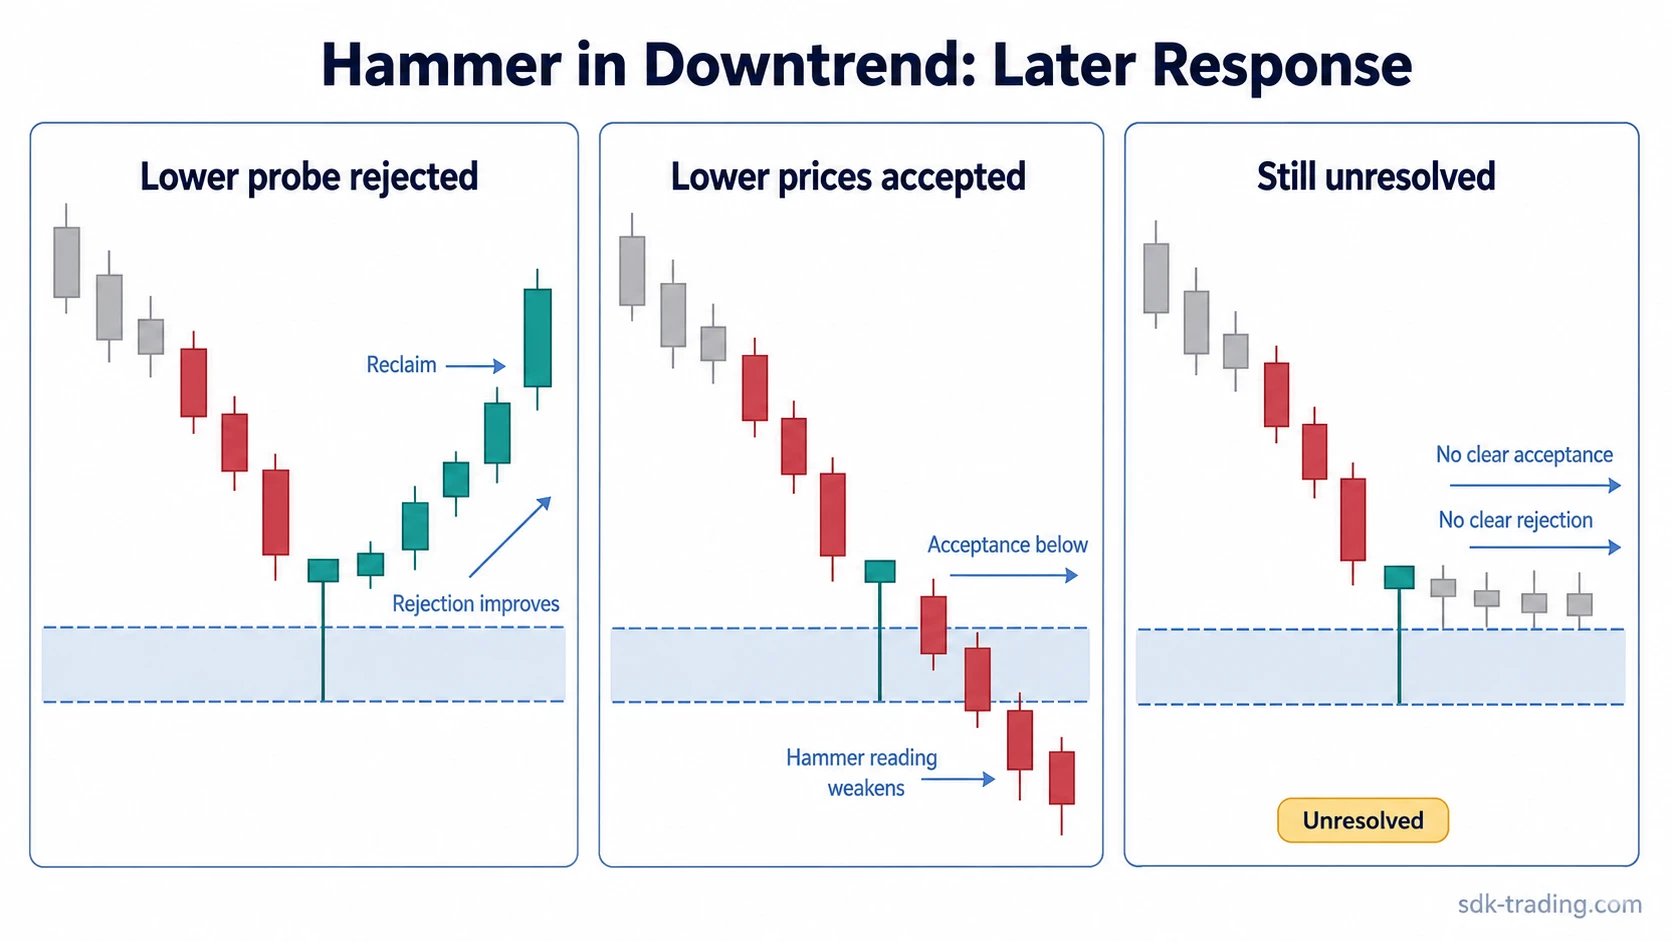
| Next candles accept below the wick low | The lower probe has not been rejected. The market is showing that lower prices can still be accepted. | The hammer reading weakens sharply because the wick low stops acting like a failed lower probe. |
| Next candles reclaim the lower area | The rejection case improves because later price action supports the idea that the lower move failed to hold. | Recovery still needs context; one reclaim does not guarantee a full trend reversal. |
Hammer in Downtrend vs Hammer at Support
A hammer in a downtrend describes the trend context first. Price has been moving lower, and the candle appears after that bearish movement. A hammer at support describes the location first. The lower wick is testing a visible support area, prior reaction zone, or level where buyers previously responded.
The clearest overlap occurs when both conditions appear together: a downtrend brings price into a meaningful area, the lower wick probes through or into that area, and the close recovers back above it. Without that location, the candle remains easier to misread as a reversal attempt when it may only be a temporary pause.
Hammer in Downtrend vs Inverted Hammer
The main difference is wick direction. A hammer has a dominant lower wick, which means price probed lower and recovered before the close. An inverted hammer has a dominant upper wick, which means price pushed higher during the candle but failed to hold the upper move by the close.
Both can appear after a decline, but they test opposite sides of the candle range. The hammer tests lower acceptance. The inverted hammer tests whether buyers can push price upward after a decline. Confusing the two removes the most important diagnostic feature: which side of the range was probed and not retained.
Practical Failure-Mode Example
Consider a market that has been stepping lower for several candles. A new candle forms with a long lower wick and a small body near the upper part of its range. The shape looks like a hammer, and the recovery from the low makes the candle tempting to read as early reversal evidence.
The incomplete part is location. If the candle forms halfway between two visible reaction areas, the lower wick has not clearly tested a prior swing low, support area, or failed breakdown level. The candle may only show that seller pressure paused for one period, not that the downtrend has lost control.
The structural rejection case appears when the wick reaches a meaningful lower area, briefly trades below it, and then closes back above it. The weaker case appears when the next candles move below the wick low and hold there. In that failed case, the market is no longer rejecting the lower probe; it is accepting prices below the hammer’s low.
FAQ
Can a hammer candle be red in a downtrend?
Yes. A red hammer can appear in a downtrend if the candle still has a small real body near the upper part of the range, a long lower wick, and little or no upper wick. The color is secondary to the candle shape, close location, structural test, and later response.
What makes a hammer in a downtrend more defensible?
The reading becomes more defensible when the lower wick tests a meaningful area, the close recovers from the probe, and later candles avoid accepting below the hammer low.
Why is a mid-leg hammer weaker?
A mid-leg hammer is weaker because the lower wick may not be testing a meaningful area. Without a prior swing low, support area, or failed breakdown reference, the candle can be only a temporary pause inside bearish structure.