Price action is the interpretation of market movement through price itself: how candles, swings, levels, ranges, breakouts, rejections, and acceptance behave on a chart.
In trading, price action is a broad label for several chart-reading concepts, not one standalone method. It can refer to basic candle reading, support and resistance, liquidity behavior, market structure, imbalances, or setup families. The useful starting point is not to treat price action as one signal. It is a way to organize visible market behavior before adding a narrower method or condition check.
Simple boundary: price action can help describe what price is doing, where it is happening, and how accepted or rejected that behavior appears. It does not, by itself, prove direction, create a complete trading system, or confirm a trade without context.
What Price Action Means
Price action means reading market behavior from the movement of price rather than starting with a formula-derived indicator. A price-action reading usually looks at where price moves, how it reacts around important areas, and how later candles or swings support or weaken the same interpretation.
The phrase is broad because it covers both simple and advanced ideas. A new trader may use it to mean candlestick behavior around support and resistance. A more structured trader may use it to separate trend, range, liquidity sweep, imbalance, acceptance, rejection, and setup context. The same label can therefore describe a basic observation or a broader decision framework, depending on how precisely it is used.
| Price action can describe | What it helps clarify | What it does not prove alone |
|---|---|---|
| Candles and swings | How price moved during a visible sequence | That the next candle must continue in the same direction |
| Support and resistance | Where price has previously reacted or paused | That the area will hold again |
| Breaks and rejections | How price tested, failed, or accepted an area | That every break is a valid setup |
| Trend and range behavior | How directional, rotational, or unresolved movement appears | That the environment is easy to trade |
How Price Action Concepts Fit Together
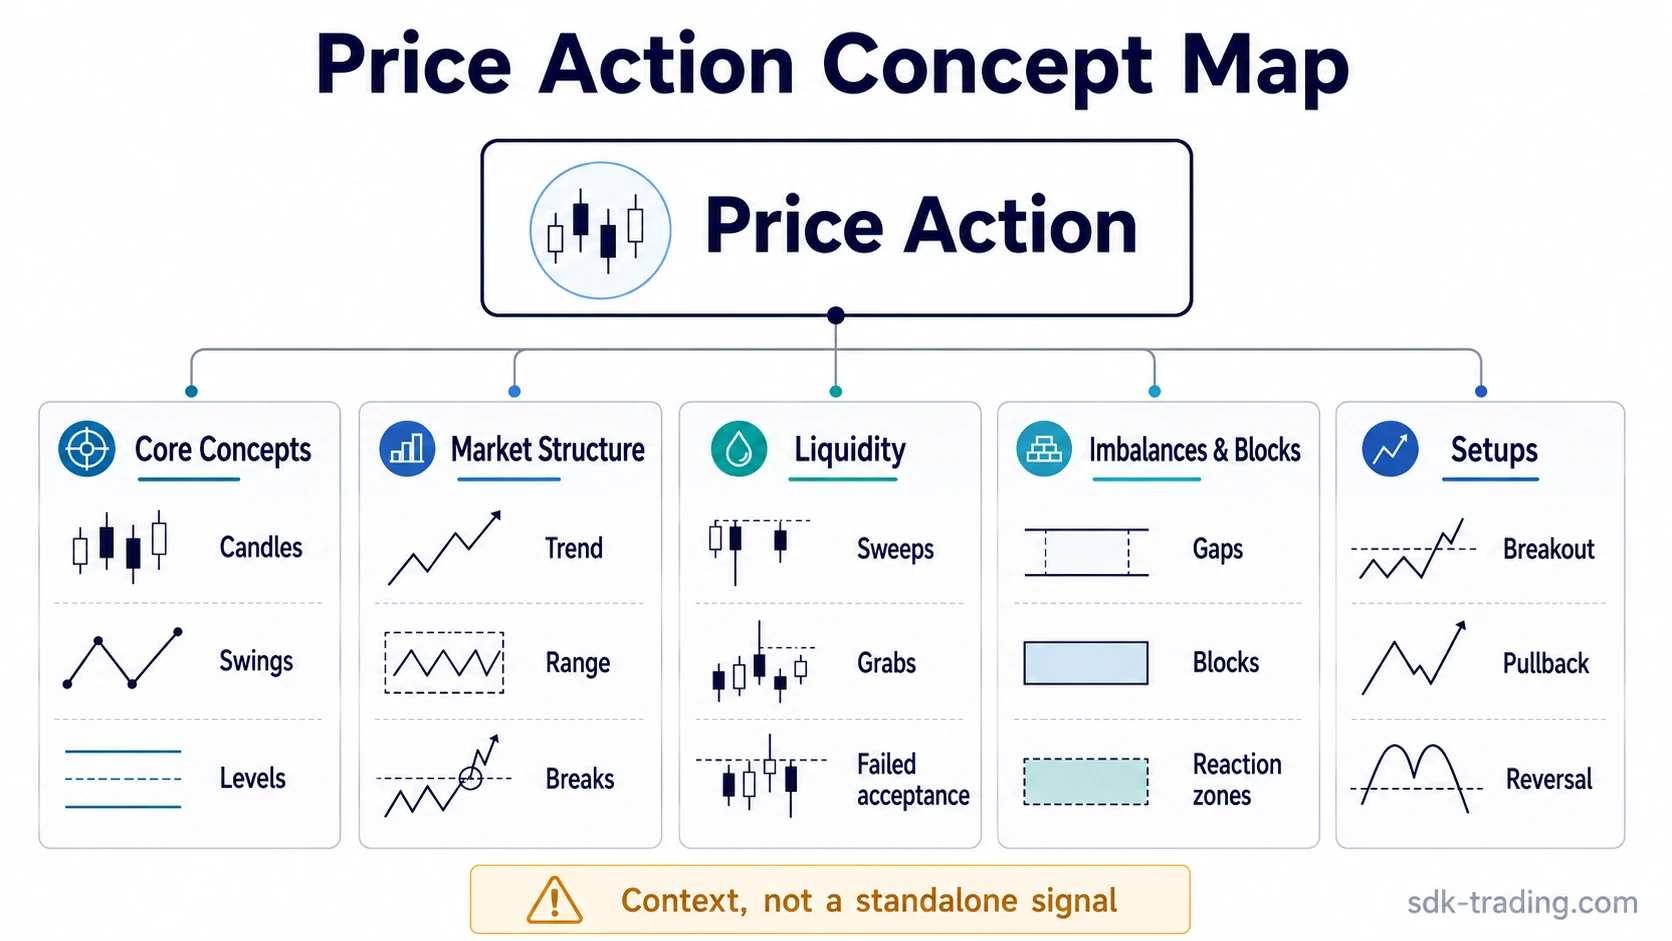
Price action becomes easier to read when the terms are separated into concept groups. A support level, a liquidity sweep, a market-structure break, and an imbalance are not the same idea. They can appear near each other, but each one answers a different chart-reading question.
| Concept group | Main question | Typical focus |
|---|---|---|
| Core concepts | What basic price areas or reactions are being studied? | Support, resistance, supply, demand, reversals, and multi-timeframe context |
| Market structure | How is price movement organized? | Trends, swings, ranges, breaks, shifts, and continuation or reversal structure |
| Liquidity | Where might price interact with clustered orders or obvious reference areas? | Sweeps, grabs, stop runs, and failed acceptance around visible areas |
| Imbalances and blocks | Where did price move inefficiently or leave a notable reaction zone? | Imbalances, fair value gaps, order blocks, mitigation areas, and related concepts |
| Setups | How are multiple conditions combined into a defined framework? | Breakout, reversal, pullback, continuation, fakeout, and trend-following families |
The distinction matters because a broad price-action label can hide very different assumptions. A rejection candle at resistance is a visible observation. A reversal setup requires additional conditions. A liquidity sweep reading requires later behavior that shows how the tested area was accepted or rejected.
Choose the Right Price Action Area
Different price-action questions need different starting points. The best path depends on what is unclear: the basic term, the structure of the move, the role of liquidity, the meaning of an imbalance, or the setup family being considered.
| Question | Best starting area |
|---|---|
| How are support, resistance, supply, demand, reversals, or basic chart areas defined? | Core price action concepts |
| Is price trending, ranging, breaking structure, rotating, or forming a new swing sequence? | Market structure |
| How do obvious highs, lows, order clusters, stop runs, sweeps, or failed acceptance fit into the reading? | Liquidity |
| What do fast movement areas, reaction zones, fair value gaps, or order-block style references mean? | Imbalances and blocks |
| How are conditions grouped into breakout, reversal, continuation, pullback, fakeout, or trend-following frameworks? | Price action setups |
What Price Action Includes and Excludes
A price-action reading can be useful only when the boundary is clear. It can describe visible behavior, compare reactions, and organize context. It becomes weaker when one candle, one level, or one pattern is treated as a complete decision.
| Included in price action | Needs more context | Not included by itself |
|---|---|---|
| Reaction around a prior high, low, support, or resistance area | Acceptance, rejection, or unresolved behavior after the reaction | A guaranteed reversal |
| Breakout, failed breakout, or range expansion behavior | Price holding beyond the area or falling back inside the range | A complete entry and exit plan |
| Shift from range behavior into directional movement | Later swings and structure supporting or weakening the shift | A prediction that the move will continue |
| Visible imbalance, gap, or fast displacement area | Later price behavior respecting, filling, or ignoring the area | A standalone signal |
Where Price Action Readings Become Weaker
Price action can become subjective when the same chart is read through different assumptions. One trader may see a breakout. Another may see an overextended move. A third may wait because price has not shown clear acceptance or rejection around the new area.
The reading weakens when it depends on a single candle, ignores the surrounding structure, or treats a level as exact instead of an area. It also weakens when the market is moving through noisy conditions where reactions are frequent but follow-through is poor.
Context check: a price-action observation is stronger when the location, structure, reaction, and later behavior all point to the same interpretation. It is weaker when those pieces conflict or when the observation is being used as a shortcut for a full plan.
Price Action vs Indicators
Price action and indicators are different ways to organize market information. Price action starts with visible chart behavior. Indicators transform market data through formulas, which can help summarize trend, momentum, volatility, or participation.
The two approaches do not need to compete. A trader may use price action to define the chart area being studied and an indicator to add a separate condition check. The weak version is using several tools to repeat the same idea while ignoring how price has actually accepted or rejected the area being watched.
Common Price Action Misreads
| Misread | Why it happens | Cleaner interpretation |
|---|---|---|
| Calling every rejection candle a reversal | The candle looks decisive in isolation | A reversal reading needs location, structure, and later acceptance or rejection behavior |
| Treating a breakout as complete at the first push | Price has moved beyond a visible area | A breakout reading is cleaner when price shows how the new area behaves after the first push |
| Seeing liquidity behavior after every sharp move | Fast movement feels intentional | A liquidity reading needs a clear reference area and later evidence of failed or accepted movement |
| Using setup names before conditions are defined | The label sounds more certain than the chart | A setup label should come after the conditions are visible, not before |
FAQ
What does price action mean in trading?
Price action means interpreting market movement from price behavior on a chart. It focuses on candles, swings, levels, ranges, breakouts, rejections, and acceptance rather than starting with formula-derived indicators.
Is price action the same as a trading strategy?
No. Price action can be part of a trading strategy, but it is not a complete strategy by itself. A strategy needs defined conditions, risk rules, failure boundaries, and review logic.
What concepts are part of price action?
Price action can include support and resistance, supply and demand, market structure, liquidity behavior, imbalances, order-block style references, breakouts, reversals, pullbacks, and setup families.
Why can price action be subjective?
Price action can be subjective because traders may choose different reference areas, timeframes, and confirmation conditions. A cleaner reading separates the observation from the conclusion and checks whether later behavior supports it.