Divergence signals classify disagreement between price swings and indicator swings across comparable turning points. The first requirement is a valid pair of price highs or lows and corresponding indicator peaks or troughs. Without comparable swing points, the divergence label becomes unstable.
Definition: Divergence forms when two comparable price swings and two corresponding indicator swings move in different structural directions. Regular divergence compares a new price extreme with weaker indicator momentum, while hidden divergence compares a trend-preserving price swing with a stronger opposite move in the indicator.
Key Points
- Divergence requires comparable turning points in both price and the indicator.
- Regular bullish divergence compares a lower price low with a higher indicator low, while regular bearish divergence compares a higher price high with a lower indicator high.
- Hidden divergence uses a different relationship and is normally evaluated inside an existing trend.
- RSI and MACD can produce different divergence readings because they transform price through different calculations.
- Regular divergence can persist while a strong trend continues, so momentum disagreement does not provide precise reversal timing.
Divergence Signal Classification
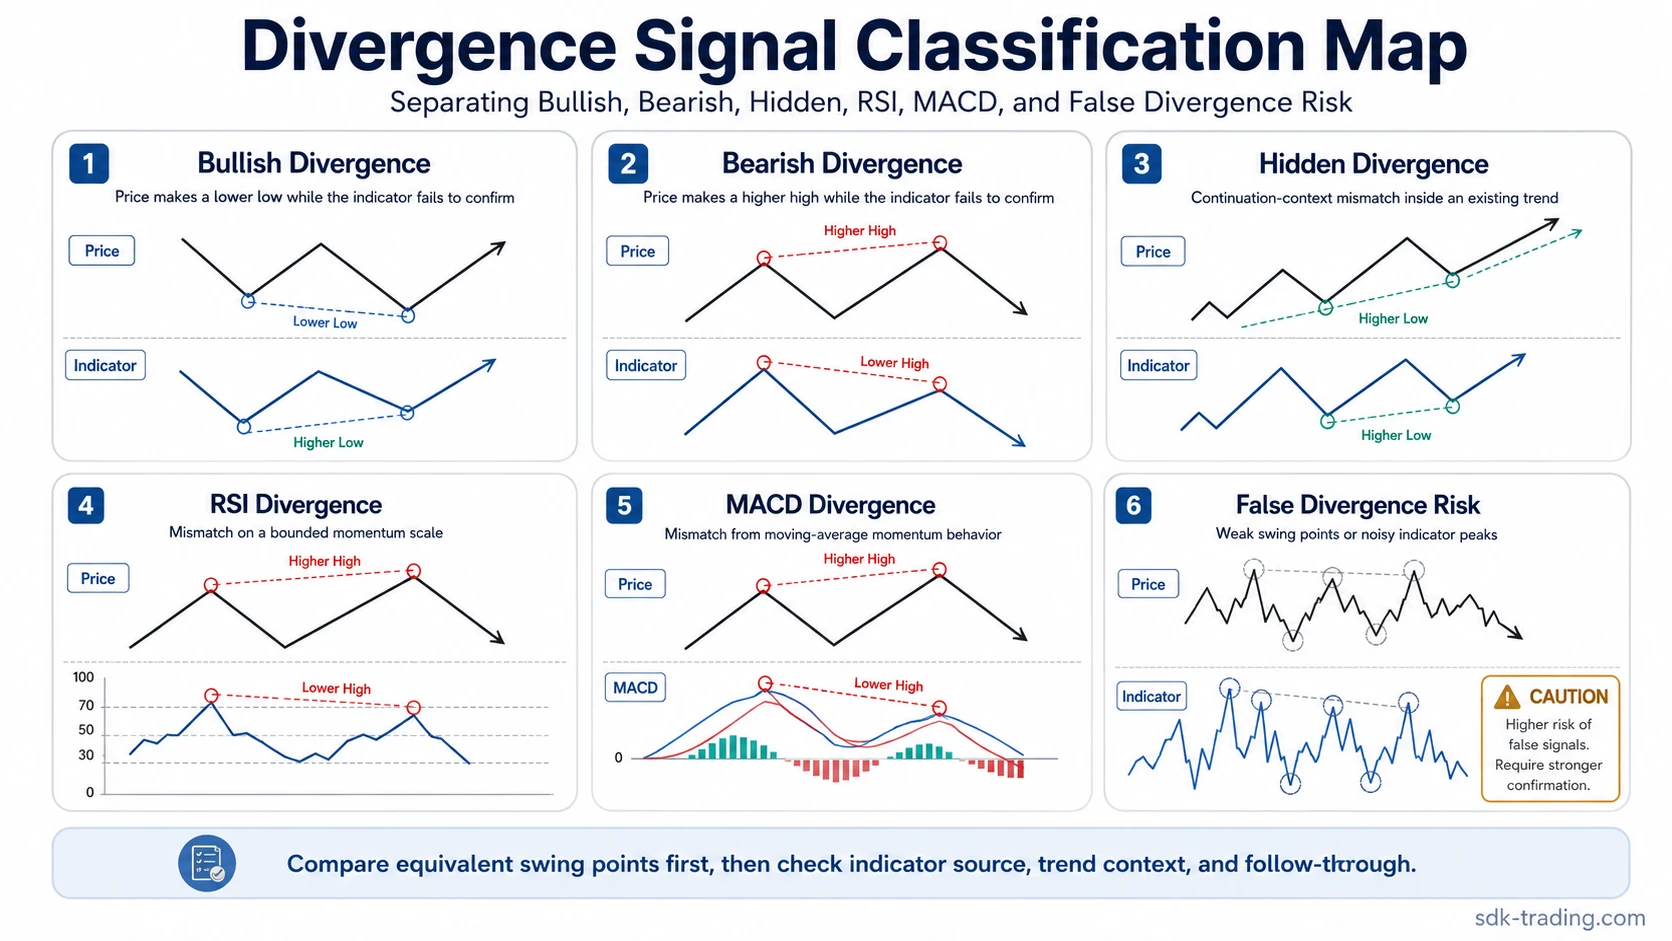
After confirming that the swing points are comparable, separate the divergence by structural relationship and indicator source. This keeps broad divergence, regular bullish or bearish divergence, hidden divergence, and indicator-specific readings from being treated as interchangeable.
| Condition | Relevant page | Classification boundary |
|---|---|---|
| The goal is to understand the broad price-versus-indicator relationship. | Divergence in trading | The focus is the general divergence concept before direction or indicator type is selected. |
| Price forms a lower low while the indicator forms a higher low. | Bullish divergence | Regular bullish divergence compares downside price extension with weaker downside momentum. |
| Price forms a higher high while the indicator forms a lower high. | Bearish divergence | Regular bearish divergence compares upside price extension with weaker upside momentum. |
| Price preserves the prevailing trend structure while the indicator forms a more extreme counter-swing. | Hidden divergence | The relationship is evaluated as a continuation structure rather than a regular exhaustion pattern. |
| The divergence is measured with the Relative Strength Index. | RSI divergence | The oscillator swing comes from RSI’s bounded gain-loss calculation. |
| The divergence is measured with MACD. | MACD divergence | The oscillator relationship comes from MACD line, signal-line, or histogram behavior derived from moving averages. |
| RSI and MACD produce different readings on the same price movement. | RSI divergence vs MACD divergence | The comparison isolates how different indicator calculations transform the same price swing. |
How Comparable Swing Points Create Divergence
Divergence compares relationships, not isolated indicator values. A price high should be compared with another meaningful price high, while the corresponding indicator peak should be compared with the indicator peak associated with that price swing. The same logic applies to lows and troughs.
The comparison deteriorates when one side uses a major swing and the other uses a minor fluctuation. A clear price extreme paired with a small oscillator ripple may draw two lines in opposite directions without producing a defensible divergence structure.
Swing-point check: Identify the two price pivots first, match each pivot to the corresponding indicator swing, and only then compare their directions.
Regular Divergence vs Hidden Divergence
Regular and hidden divergence use different price relationships. Regular divergence appears when price extends to a new extreme while the indicator fails to make the same directional extreme. Hidden divergence appears when price preserves the trend structure while the indicator makes the more extreme counter-move.
| Type | Price relationship | Indicator relationship | Structural use |
|---|---|---|---|
| Regular bullish | Lower low | Higher low | Downside momentum disagreement |
| Regular bearish | Higher high | Lower high | Upside momentum disagreement |
| Hidden bullish | Higher low | Lower low | Continuation structure inside an uptrend |
| Hidden bearish | Lower high | Higher high | Continuation structure inside a downtrend |
Why Divergence Can Persist in a Strong Trend
An oscillator measures a transformed version of price movement rather than the trend itself. Momentum can therefore slow relative to an earlier swing while price continues to advance or decline. A new price extreme can coexist with a weaker oscillator extreme for several successive swings.
This is why regular divergence can remain visible during a strong directional move without producing an immediate reversal. The divergence records a change in relative momentum. It does not specify when the existing price structure must break.
Trend position therefore changes the interpretation. Repeated bearish divergence inside a strong advance can describe progressively weaker momentum while the sequence of price highs and lows remains intact. The same principle applies to repeated bullish divergence during a strong decline.
Why RSI and MACD Divergence Can Disagree
RSI and MACD do not measure momentum in the same way. RSI compares recent gains with recent losses and places the result on a bounded scale. MACD is derived from the relationship between moving averages and can also be examined through its signal line or histogram.
Because the calculations respond differently to the same price path, one indicator can form a clear divergent swing while the other does not. That disagreement does not automatically make either reading incorrect. It means the indicators are describing different transformations of the same movement.