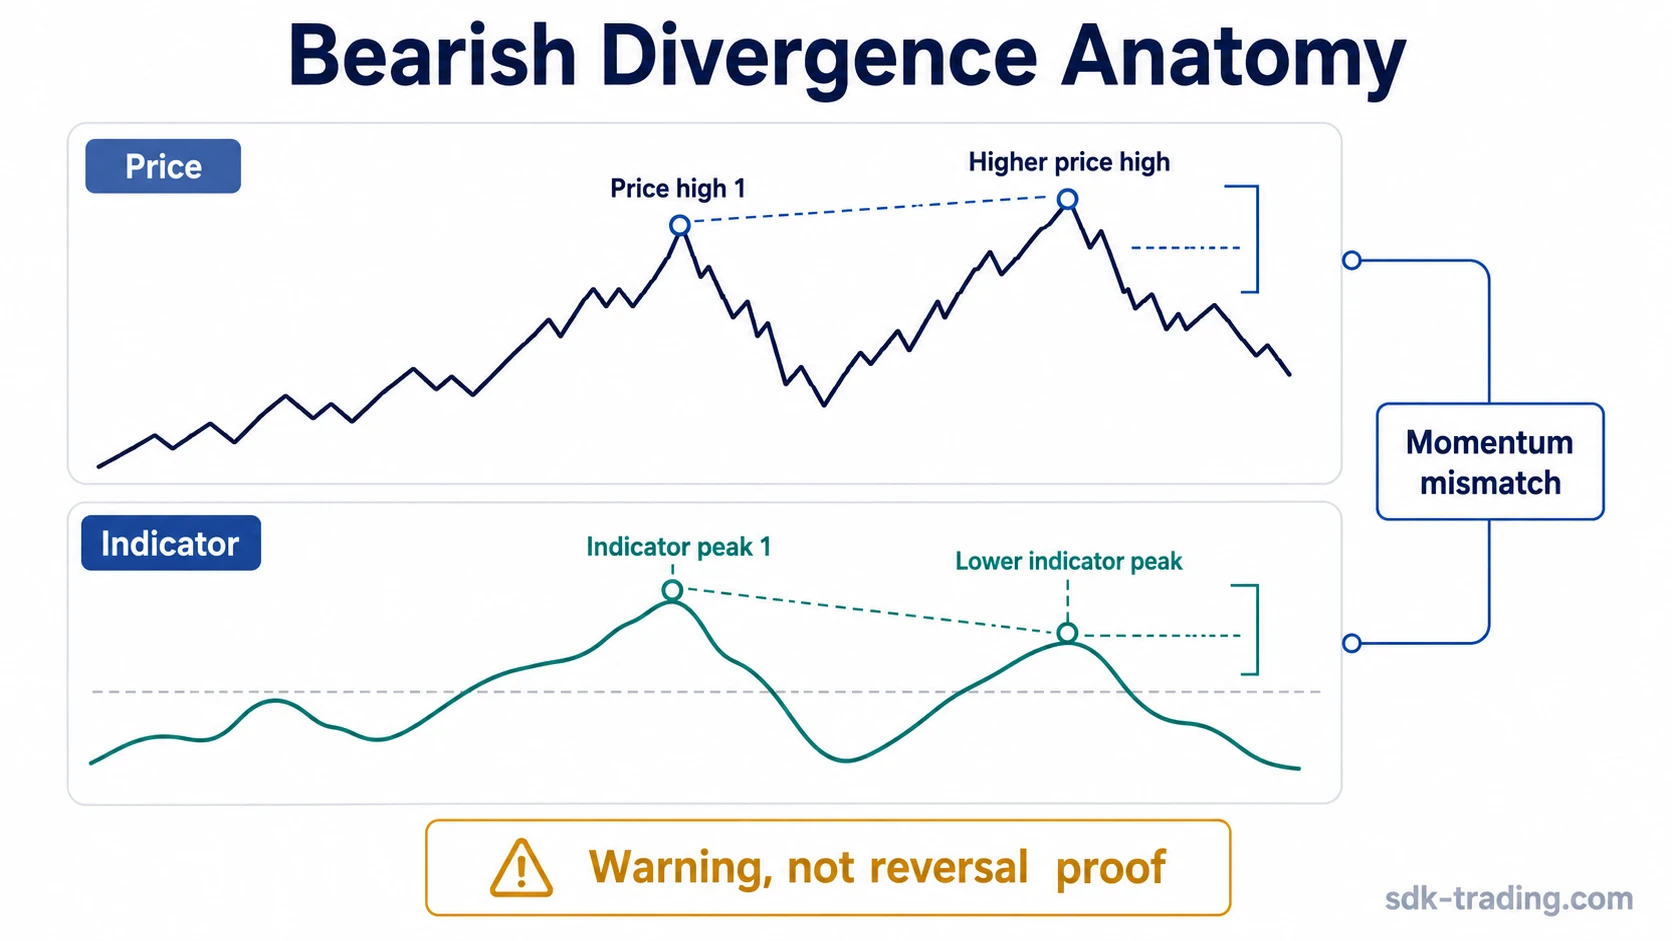
Bearish divergence appears when price makes a higher high while a technical indicator makes a lower high. The mismatch can warn that upside momentum is weakening, but it does not prove that a reversal has already started.
Definition: Bearish divergence is a regular divergence pattern in trading where price extends to a higher high, while an indicator such as RSI or MACD fails to confirm that new high with its own higher reading.
The useful signal is the relationship between price structure and indicator behavior. Price is still pushing upward, but the indicator is showing less force behind the move. That makes bearish divergence a warning condition, not a completed market turn.
Key Points
- Bearish divergence compares a higher price high with a lower indicator high.
- The pattern is usually read after an upward move or during a test of higher levels.
- A clean structure needs comparable swing highs, not random indicator noise.
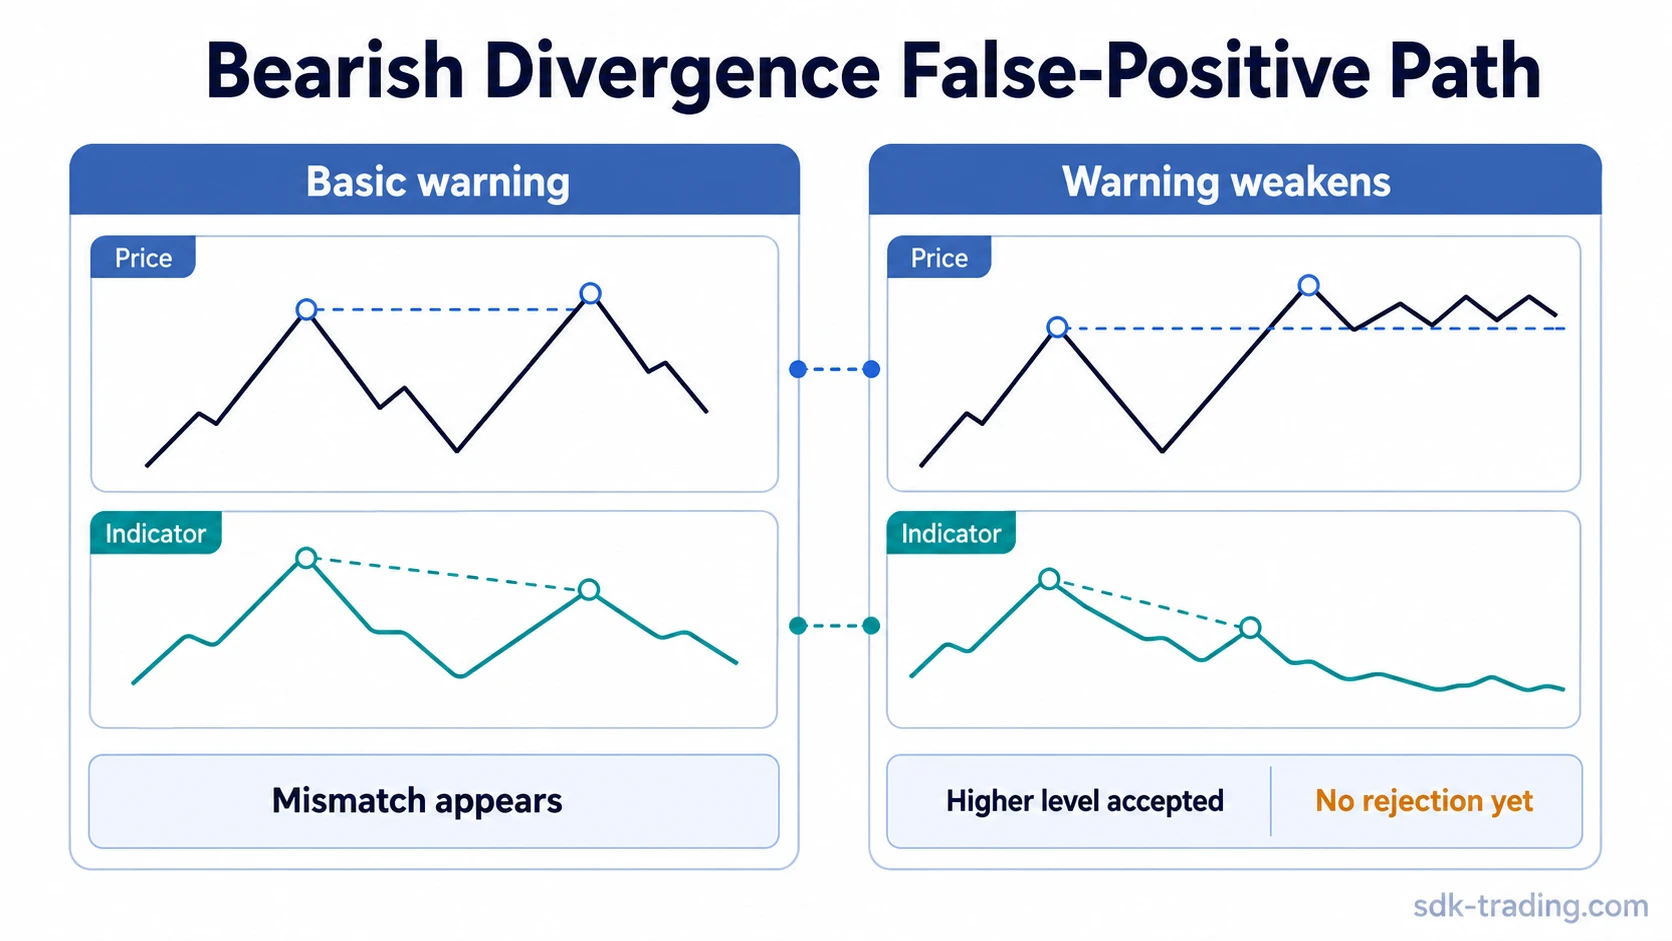
- The bearish case weakens when price accepts the higher level and the indicator later resets.
- RSI and MACD can both display bearish divergence, but neither indicator owns the concept.
What Bearish Divergence Means
Bearish divergence means that price is making progress on the chart while the indicator is no longer confirming the same strength. In a standard reading, the second price high is higher than the first, while the second indicator high is lower than the first.
That difference matters because many oscillators and momentum indicators are designed to reflect the force behind price movement. When price pushes higher but the indicator peak is lower, the advance may be losing momentum beneath the surface.
The broader concept is part of divergence in trading, where price behavior and indicator behavior move out of alignment. Bearish divergence is the downside-warning version of that relationship.
How Bearish Divergence Forms
A bearish divergence setup starts with two comparable swing highs. The first price high creates the reference point. The second price high must exceed the first, while the indicator peak at the second high must stay below its earlier peak.
The swing points need to be comparable. A clean structure does not compare a major price high with a minor indicator wiggle, or a clear indicator peak with a noisy price pause. The pattern is strongest when both price and indicator peaks are visible without forcing the comparison.
The indicator can fail to confirm price strength for several reasons. Momentum may be fading, or the second push may show less force than the earlier advance. The exact cause depends on the indicator, market, and surrounding structure.
| Element | Bearish divergence structure | Why it matters |
|---|---|---|
| Price structure | Second swing high is higher than the first swing high. | Price is still extending upward. |
| Indicator structure | Second indicator peak is lower than the first indicator peak. | Momentum is not confirming the price extension. |
| Interpretation | Upside progress and momentum no longer agree. | The move may be vulnerable, but reversal is not proven. |
Clean, Weak, and Invalid Bearish Divergence
The main practical distinction is not whether bearish divergence exists in a mechanical sense. The stronger question is whether the mismatch is clean enough to matter, too weak to carry much weight, or invalidated by later price behavior.
| Classification | Chart behavior | Interpretation boundary |
|---|---|---|
| Clean | Price makes a clear higher high, the indicator makes a clear lower high, and price begins failing to hold higher levels. | The warning is easier to read because structure and momentum are visibly diverging. |
| Weak | The indicator difference is shallow, the swing points are messy, or price moves sideways after the mismatch. | The pattern may be present, but the evidence is too thin to treat as a strong warning. |
| Invalid | Price accepts the higher high, continues building above it, and the indicator later resets without downside follow-through. | The bearish case loses force because price structure no longer supports the warning. |
Bearish divergence should be treated as a structure-and-momentum mismatch, not as a prediction. The indicator mismatch can warn of fading momentum, but price structure determines whether that warning becomes useful or fails.
What Bearish Divergence Is Not
Bearish divergence is not the same as a completed reversal. A market can show a higher price high and a lower indicator high, then still continue upward if buyers keep accepting higher prices.
It is also not limited to one indicator. RSI, MACD, and other momentum tools can show divergence in different ways. The concept belongs to the price-versus-indicator relationship, not to a single formula or setting.
A bearish divergence signal also does not instruct a position by itself. The pattern describes a condition: price has pushed higher while momentum has failed to confirm. Any stronger interpretation depends on later structure, failure to hold higher levels, and whether the market stops accepting the new high.
Bearish Divergence vs Hidden Bearish Divergence
Regular bearish divergence compares a higher price high with a lower indicator high. It usually appears after an upward move and warns that the latest price extension may have weaker momentum behind it.
Hidden divergence describes a different divergence structure. Hidden bearish divergence is usually treated as a continuation-style reading, not the same structure as regular bearish divergence. Mixing the two can blur whether the chart is warning about fading upside momentum or continuing downside pressure.
RSI and MACD Bearish Divergence Examples
With RSI divergence, the comparison is between price highs and RSI peaks. A bearish RSI divergence appears when price makes a higher high while RSI makes a lower high, suggesting that the second price push has weaker relative momentum.
With MACD divergence, the comparison may involve the MACD line, signal-line relationship, or histogram behavior, depending on the method used. The same boundary remains: the indicator must fail to confirm the higher price high.
RSI and MACD examples are useful because they make the structure visible. They should not turn bearish divergence into an indicator-settings debate. The core condition remains the same: price advances, while the chosen momentum measure does not confirm the advance.
Bearish Divergence False-Positive Scenario
Price advances into a prior resistance area and briefly trades above the earlier high. The indicator makes a lower high, so the chart has the basic shape of bearish divergence. The warning is tempting because price has stretched higher while momentum is fading.
The setup remains incomplete if price does not reject the higher area. If price holds above the prior high, moves sideways without breaking down, and the indicator gradually resets, the bearish interpretation weakens. The mismatch warned of softer momentum, but price acceptance prevented the warning from developing into a stronger structural failure.
The false-positive path matters because divergence can appear before a pause, before a sideways range, or before a continuation. A cleaner bearish case needs more than the indicator mismatch. It needs price behavior that stops accepting the higher level.
Related Divergence Concepts
These distinctions keep regular bearish divergence separate from the broader divergence family, continuation-style divergence, and indicator-specific versions.
| Concept | Diagnostic distinction |
|---|---|
| Divergence in trading | The broader category of price-versus-indicator disagreement. Bearish divergence is one directional form inside that category. |
| Hidden divergence | A continuation-style divergence family that should not be merged with regular bearish divergence. |
| RSI divergence | An indicator-specific implementation that uses RSI peaks against price swing points. |
| MACD divergence | An indicator-specific implementation that uses MACD behavior against price swing points. |
FAQ
Can bearish divergence appear while price keeps rising?
Yes. Bearish divergence can appear before a pause, range, or continued advance. The bearish reading weakens if price accepts the higher level and the indicator resets without downside follow-through.
Is bearish divergence the same as a reversal?
No. Bearish divergence can warn that upside momentum is fading, but a reversal is not confirmed unless later price behavior fails to hold higher levels.
What makes bearish divergence fail?
Bearish divergence weakens when price accepts the higher high, continues building above it, or moves sideways long enough for the indicator to reset without downside follow-through.