RSI divergence is a technical-analysis reading where price swing direction and RSI swing direction disagree. The basic shape can warn that momentum is changing, but the raw divergence is not confirmation by itself.
Definition: RSI divergence forms when price makes a new swing high or swing low while the Relative Strength Index fails to make the same kind of swing. The comparison only works when the price points and RSI points represent equivalent pivots.
The main task is not to treat the RSI line as a standalone trigger. A stronger reading comes from comparing price structure, RSI behavior, trend context, and later acceptance or rejection around the tested area.
Key Points
- RSI divergence compares price swings with RSI swings, not random candles with random indicator points.
- Regular bullish and bearish divergence describe possible momentum disagreement during new price extremes.
- Hidden RSI divergence is secondary and usually depends more on trend context.
- RSI is bounded between 0 and 100, so threshold zones and smoothing can distort the reading.
- The reading changes quality only after price behavior adds evidence around the tested area.
What RSI Divergence Means
RSI divergence means the price chart and RSI are no longer moving together at comparable swing points. Price may still push to a fresh extreme, while RSI shows less momentum behind that move.
That disagreement is a warning condition, not a complete market conclusion. A clean reading needs a visible price swing, a comparable RSI swing, and later behavior that clarifies whether the market is accepting or rejecting the new price area.
RSI divergence is one form of divergence in trading, but it has its own limits because RSI is a bounded oscillator rather than an unbounded momentum line.
How RSI Divergence Forms
The structure starts with two price pivots and two RSI pivots. The first price pivot and the first RSI pivot create the comparison point. The second price pivot and second RSI pivot decide whether the two series agree or diverge.
| Component | What to compare | Why it matters |
|---|---|---|
| Price swing | Higher high, lower low, higher low, or lower high | Defines the market structure being tested |
| RSI swing | RSI high or low aligned with the same market swing | Shows whether momentum confirms or disagrees with price |
| Comparable pivots | Equivalent swing points, not arbitrary RSI bumps | Reduces false divergence from mismatched points |
| Trend context | Strong trend, range, pullback, or exhaustion area | Changes whether divergence is meaningful or fragile |
| Later behavior | Acceptance, rejection, failed extension, or continued compression | Helps separate a live warning from a failed reading |
The most common weak reading comes from drawing RSI divergence between points that do not belong to the same swing hierarchy. A small RSI dip inside a larger trend leg may not match the price pivot being compared with it.
RSI Mechanics Behind Divergence
RSI is a bounded oscillator that moves between 0 and 100. It compares recent upward and downward price changes over a selected lookback period, with 14 periods often used as a common default setting.
The bounded design matters because RSI cannot expand endlessly with price. During a strong trend, price can keep extending while RSI compresses, flattens, or repeatedly stays near an upper or lower zone. That can create divergence-like shapes before market structure has actually changed.
RSI threshold note: The 70 and 30 zones are commonly used as overextended reference areas, but they are not automatic action levels. A strong trend can keep RSI elevated or depressed while price continues to accept new levels.
Lookback length and smoothing also affect the reading. A shorter RSI setting may produce more swings and more divergence candidates. A longer setting may filter noise but react more slowly. The setting does not remove the need to compare equivalent price and RSI pivots.
Bullish, Bearish, and Hidden RSI Divergence
Regular RSI divergence focuses on price pushing to a new extreme while RSI fails to confirm that extreme. Hidden divergence compares pullbacks inside an existing trend and should stay secondary unless the trend structure is clear.
| Type | Price behavior | RSI behavior | Basic interpretation |
|---|---|---|---|
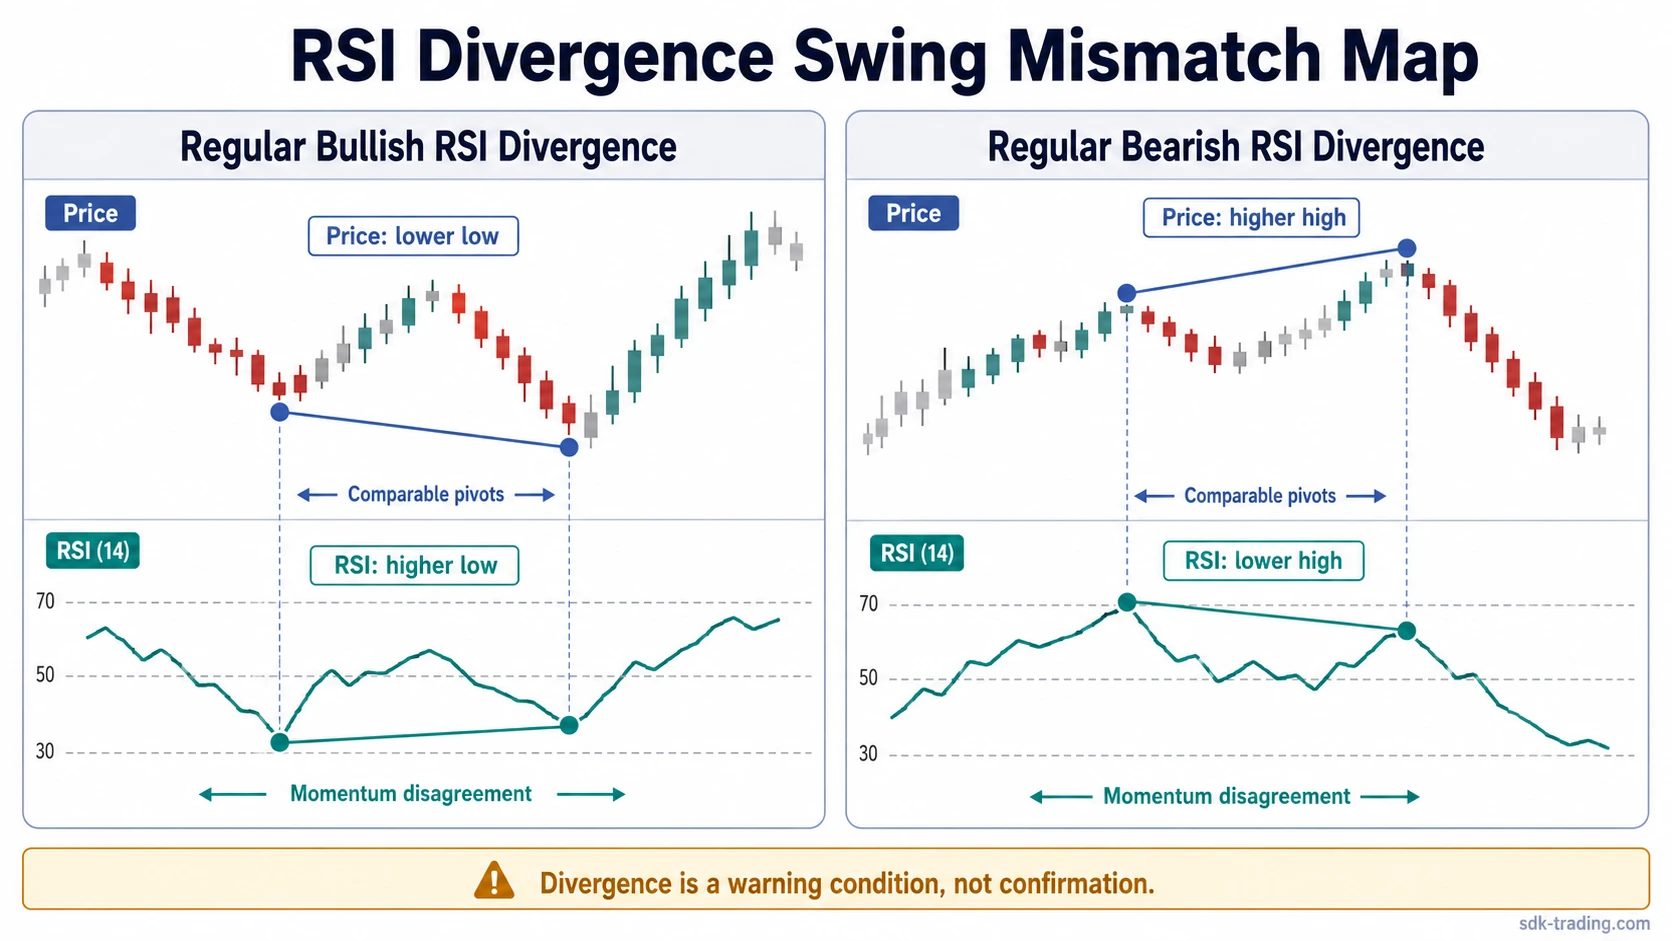
| Regular bullish RSI divergence | Price makes a lower low | RSI makes a higher low | Downside momentum may be weakening |
| Regular bearish RSI divergence | Price makes a higher high | RSI makes a lower high | Upside momentum may be weakening |
| Hidden bullish RSI divergence | Price makes a higher low | RSI makes a lower low | A pullback may be losing pressure within an uptrend |
| Hidden bearish RSI divergence | Price makes a lower high | RSI makes a higher high | A recovery attempt may be losing pressure within a downtrend |
The bullish form can overlap with broader bullish divergence, but RSI-specific interpretation still depends on oscillator behavior, threshold compression, and pivot quality.
Clean, Weak, and Failed RSI Divergence Readings
The shape alone is only the starting point. RSI divergence becomes more useful when the swing comparison is clean and later price behavior supports the interpretation. It weakens when the reading depends on mismatched pivots, threshold assumptions, or a trend that continues accepting new prices.
| Reading stage | What is visible | Required condition | Interpretation boundary |
|---|---|---|---|
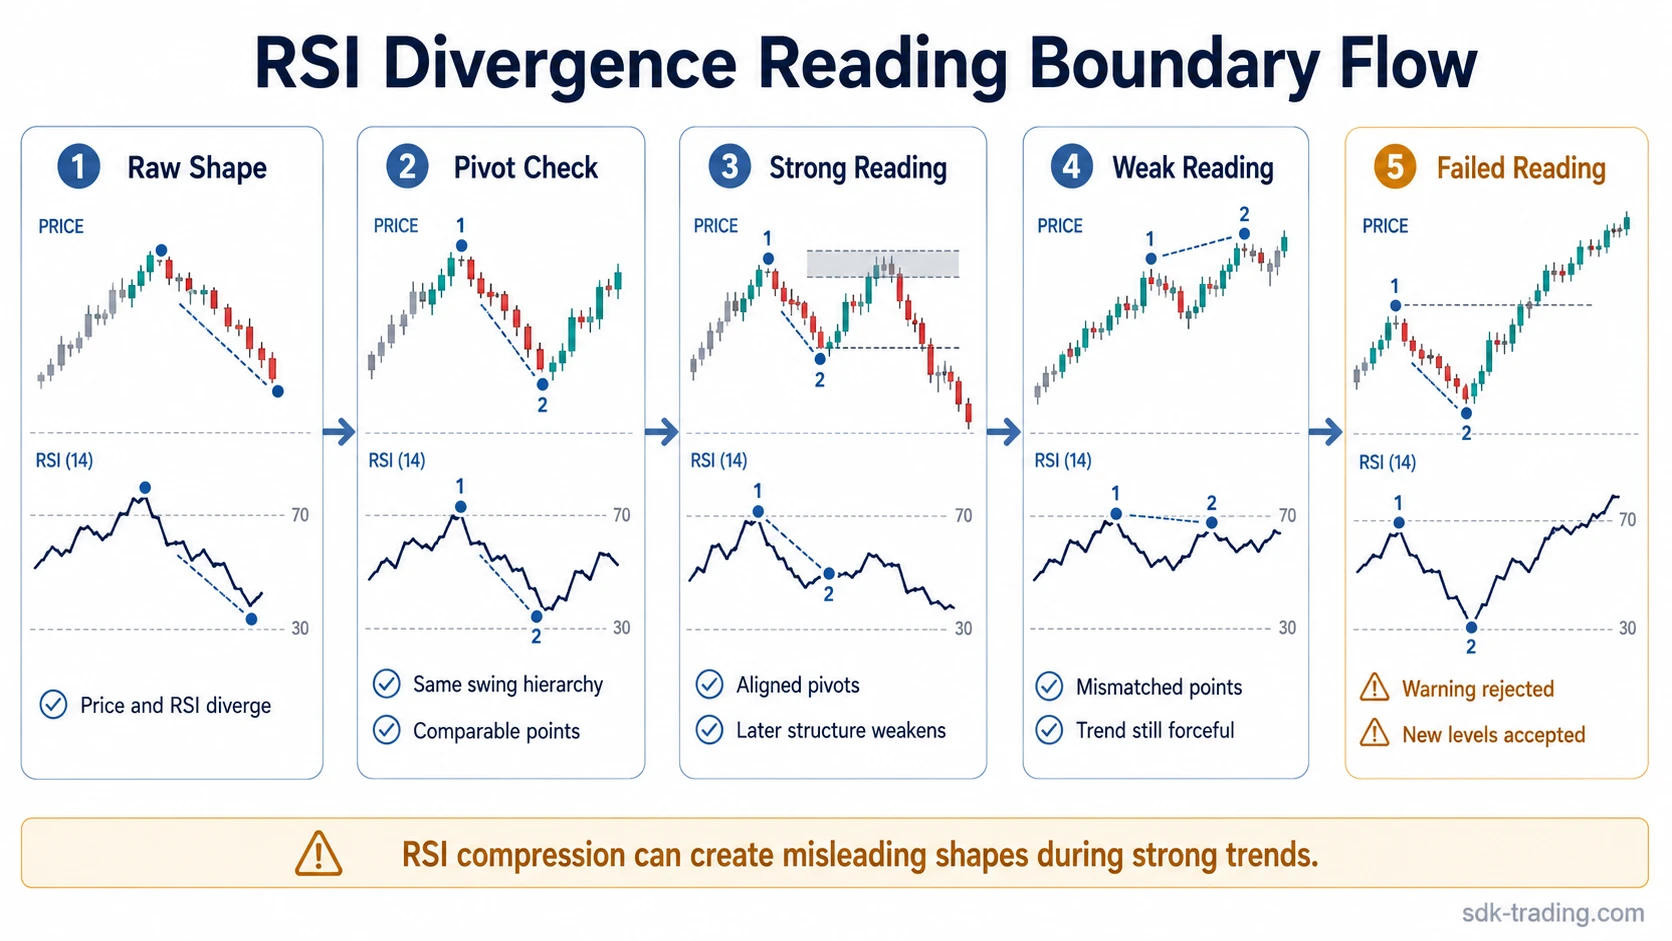
| Raw RSI divergence | Price and RSI point in different swing directions | Two comparable price pivots and two comparable RSI pivots | Only a momentum disagreement, not confirmation |
| Clean reading | The second price extreme fails to receive matching RSI confirmation | The pivots belong to the same swing hierarchy | The reading becomes more defensible if later structure also weakens |
| Weak reading | The divergence exists only on small or mismatched RSI points | Trend context remains forceful or price still accepts new extremes | The disagreement may reflect oscillator compression rather than real structural change |
| Failed reading | Price continues extending after the divergence appears | Later behavior rejects the divergence interpretation | The earlier warning loses value because structure did not confirm weakening |
A countertrend RSI divergence against forceful momentum is especially fragile. A more defensible interpretation requires price structure to show that the prior move is weakening rather than merely pausing.
Why RSI Divergence Can Produce Failed Readings
Failed RSI divergence often appears when the oscillator changes before price structure changes. RSI may stop making new extremes while price continues to advance or decline because the trend is compressing, not because control has shifted.
Common mistake: Treating an overextended RSI zone as proof that price must reverse. RSI can remain stretched while trend acceptance continues, especially when price keeps holding beyond prior swing areas.
Several conditions make RSI divergence less dependable:
- Mismatched swing points: the RSI points do not correspond to equivalent price pivots.
- Strong trend persistence: price keeps accepting new highs or lows despite weaker RSI readings.
- Timeframe mismatch: divergence on one timeframe conflicts with stronger structure on another.
- RSI compression: the oscillator flattens because it is bounded, not because price pressure has reversed.
- Threshold misread: 70/30 zones are treated as conclusions instead of context.
Confirmation works best as a condition that strengthens or weakens the reading. It should not be treated as proof of a future move.
RSI Divergence vs Related Concepts
RSI divergence belongs to the broader divergence family, but the RSI version depends on bounded oscillator mechanics. That makes threshold behavior, lookback length, and RSI swing quality more important than in some other momentum tools.
MACD divergence uses a different momentum structure because MACD is built from moving-average relationships rather than a 0-100 oscillator. The comparison is useful when the question is about oscillator mechanics, but RSI divergence should be judged first on RSI-specific swing behavior.
Practical distinction: Broader divergence asks whether price and a reference measure disagree. RSI divergence asks whether that disagreement remains meaningful after accounting for RSI’s bounded scale, smoothing, threshold zones, and pivot alignment.
Simple RSI Divergence Example
Price advances into a prior resistance area and briefly trades above the earlier swing high. RSI, however, forms a lower high against the prior RSI peak. The bearish RSI divergence reading is cleaner if both highs are comparable swings and the next price attempt fails to hold above the tested area.
The same shape is weaker if the RSI lower high comes from a minor internal pivot while price remains accepted above the prior high. In that case, the divergence may reflect temporary oscillator compression rather than a meaningful loss of structure.
The useful comparison is not whether the RSI line disagrees once. The useful comparison is whether price behavior after the disagreement supports or rejects the momentum warning.
FAQ
What does RSI divergence mean?
RSI divergence means price and RSI disagree at comparable swing points. Price may make a new high or low while RSI fails to confirm the same momentum direction.
What is bullish RSI divergence?
Bullish RSI divergence forms when price makes a lower low while RSI makes a higher low. It can suggest weakening downside momentum, but later price behavior still decides whether the reading becomes meaningful.
What is bearish RSI divergence?
Bearish RSI divergence forms when price makes a higher high while RSI makes a lower high. It can suggest weakening upside momentum, but it is not confirmation by itself.
Why can RSI divergence produce failed readings?
RSI divergence can produce a failed reading when price continues accepting new extremes, the compared pivots do not match, the trend remains forceful, or RSI compression creates a misleading oscillator shape.
Is RSI divergence the same as MACD divergence?
No. RSI divergence uses a bounded 0-100 oscillator, while MACD divergence uses moving-average-based momentum behavior. Both compare price with momentum, but the mechanics are different.