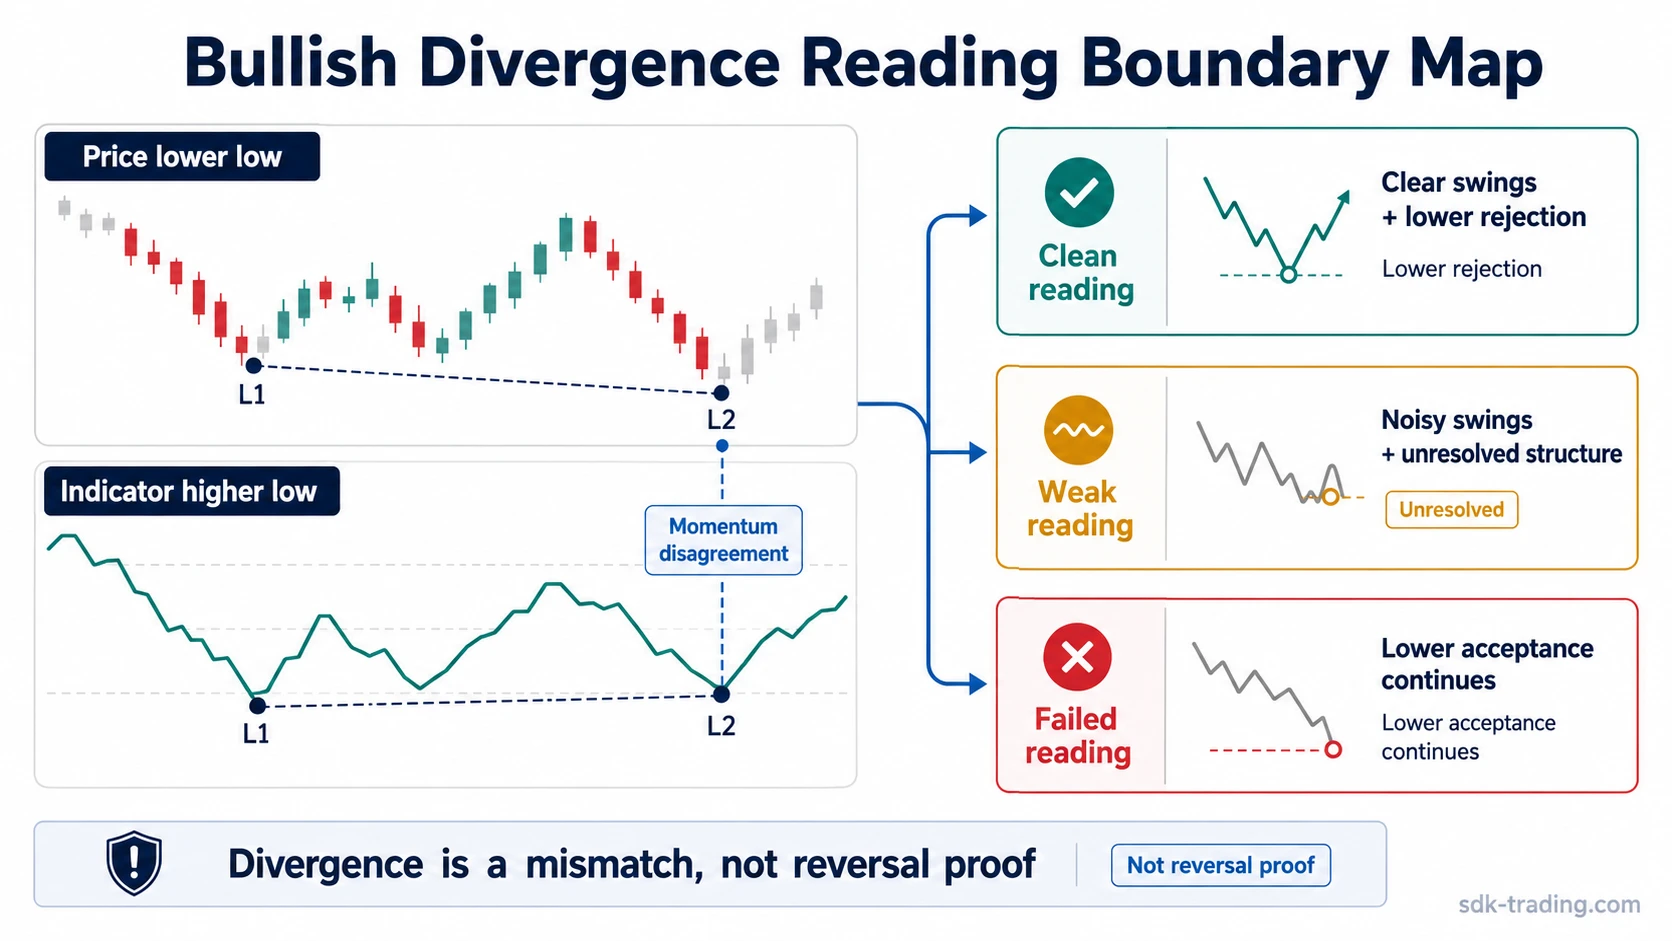
Bullish divergence appears when price makes a lower low while a selected momentum indicator makes a higher low. The mismatch can suggest weakening downside momentum, but the bullish label describes the disagreement between price and indicator behavior, not proof that a reversal has already started.
Definition: Bullish divergence is a technical analysis reading where price records a lower swing low while an indicator such as RSI, MACD, or another oscillator records a higher swing low over the same comparison area.
Key Points
- Bullish divergence compares price swing lows with indicator swing lows.
- The basic structure is price lower low plus indicator higher low.
- The reading is cleaner when the swing points are clear and price later stops accepting lower levels.
- The reading is weaker when the indicator mismatch appears inside noisy sideways movement.
- A failed reading appears when price continues to accept lower levels after the divergence forms.
Bullish Divergence: Definition and Boundary
A bullish divergence reading begins with a direct disagreement. Price is still pushing to a lower low, but the indicator is no longer making a lower low with it. That creates a recovery-side clue: downside pressure may be losing force even though price has not yet fully turned.
The word bullish can be misleading if it is read too aggressively. The label does not mean that demand has taken control. It means the indicator is showing less downside pressure than price alone appears to show. The market can still drift sideways, retest lower levels, or continue lower after the divergence appears.
A stronger reading needs a clear price swing, a clear indicator swing, and later price behavior that stops confirming the downside push. Without those pieces, bullish divergence remains only an early mismatch between price and momentum.
How Bullish Divergence Forms
Bullish divergence depends on comparable swing points. The first low and second low in price need to be visible enough to compare, and the indicator lows should line up with the same general market areas. If the swing points are unclear, the reading becomes easy to overstate.
The usual sequence is simple: price moves down into a new lower low, while the indicator holds above its previous low. That can happen because the second price push has less momentum behind it, fewer participants pressing the move, or a weaker downside impulse than the first decline.
A RSI-based divergence reading uses RSI swing lows. MACD divergence uses the MACD line, histogram, or related MACD structure depending on the method being applied.
Clean, Weak, and Invalid Bullish Divergence
The useful distinction is not whether bullish divergence exists on the chart. The useful distinction is whether the reading is clean enough to deserve attention, weak enough to remain uncertain, or invalid because price behavior keeps accepting lower levels.
| Reading quality | What the chart shows | What the interpretation means | What weakens it |
|---|---|---|---|
| Clean bullish divergence | Price makes a clear lower low while the indicator makes a clear higher low. | Downside momentum is no longer matching the new price low. | The reading loses quality if price quickly accepts lower levels again. |
| Weak bullish divergence | The price low or indicator low is unclear, compressed, or formed inside choppy movement. | The mismatch may exist, but the structure is too noisy for a strong interpretation. | The reading weakens if the next recovery attempt stalls below the broken area. |
| Invalid or failed reading | Price makes the divergence, then continues to hold below the tested area. | The market is still accepting lower prices despite the indicator disagreement. | The divergence fails if lower acceptance remains dominant after the mismatch appears. |
The mismatch gains quality when price stops extending lower and begins rejecting the tested area. It remains unresolved if price cannot reclaim that area. It loses the bullish interpretation when lower acceptance continues after the mismatch appears.
Bullish Divergence vs Nearby Divergence Concepts
The broader divergence concept includes bullish, bearish, regular, hidden, and indicator-specific forms. Bullish divergence is the recovery-side version: price makes a lower low, while the indicator refuses to confirm that lower low.
| Concept | Main structure | Boundary |
|---|---|---|
| Bullish divergence | Price lower low, indicator higher low. | Suggests weakening downside momentum, not confirmed upside control. |
| Bearish divergence | Price higher high, indicator lower high. | Opposite directional mismatch, usually watched after an advance. |
| Hidden bullish divergence | Often compares a price higher low with an indicator lower low. | Usually belongs to continuation-side interpretation rather than recovery-side reversal risk. |
| RSI divergence | Uses RSI swing behavior as the comparison tool. | Indicator-specific, not the full bullish divergence concept. |
| MACD divergence | Uses MACD structure as the comparison tool. | Indicator-specific and sensitive to MACD settings and interpretation method. |
Common Misunderstanding About the Bullish Label
Common misunderstanding: A bullish divergence label is sometimes read as if price has already confirmed a bottom. The safer reading is narrower: the latest downside push is no longer being matched by the selected indicator.
The distinction matters because price can keep falling after a divergence appears. A lower low with a higher indicator low only says that price and momentum are no longer aligned in the same way. Demand still has to show evidence that lower prices are being rejected rather than accepted.
The reading becomes more defensible when price stops making clean downside progress, recovers the tested area, or holds a later higher low. It becomes less useful when every recovery attempt fails and the market continues to build acceptance below the prior swing area.
Simple Bullish Divergence Example
Price declines into a prior low, rebounds briefly, and then trades to a lower low. The indicator does not follow with a lower low; it holds above its previous trough. The first read is a bullish divergence because price made a lower low while the indicator made a higher low.
The cleaner branch develops if price later reclaims the tested area and stops accepting lower levels. The weaker branch develops if the next recovery attempt stalls quickly and price remains below the broken area. The failed branch develops if the market continues building structure at lower prices despite the indicator mismatch.
Observation comes first: price and the indicator disagree. Interpretation only becomes stronger if later price behavior stops confirming the downside move.
Limitations and False Divergence Risk
Bullish divergence can appear too early. Indicators are derived from price, and their swing behavior can lag, smooth, or distort the underlying move depending on settings and calculation method. A higher indicator low may reflect weaker downside momentum, but it does not guarantee that demand is strong enough to change the market structure.
Noisy swing points create another problem. In sideways markets, price may make small marginal lows while the indicator creates many small mismatches. These readings can look meaningful on a close zoom but lose value when the broader structure is compressed and unresolved.
Different timeframes can also conflict. A short-term bullish divergence may appear inside a larger downtrend that is still accepting lower prices. The reading is easier to overstate when the local indicator mismatch is separated from the broader price structure.
Safe interpretation boundary: Bullish divergence is best treated as a momentum disagreement that needs later structural support. It becomes weaker when lower acceptance continues, and it fails when price behavior keeps confirming the downside move after the divergence appears.
FAQ
What is bullish divergence?
Bullish divergence is a technical analysis reading where price makes a lower low while a selected indicator makes a higher low. It can suggest weakening downside momentum, but it does not prove that a reversal has started.
Is bullish divergence reliable?
Bullish divergence is more useful when the swing points are clear and later price behavior stops accepting lower levels. It is less reliable when the mismatch appears inside noisy movement or when price continues lower afterward.
Which indicators can show bullish divergence?
RSI and MACD are common choices, but bullish divergence can be assessed with other momentum indicators. The key is comparing price swing lows with the indicator’s matching swing lows.
What is the difference between regular and hidden bullish divergence?
Regular bullish divergence usually compares a price lower low with an indicator higher low. Hidden bullish divergence is usually used for continuation-side analysis and often compares a price higher low with an indicator lower low.