Trading indicators are chart-based tools used to organize price, volume, volatility, breadth, trend, momentum, and support-resistance information. The useful starting point is not which indicator is best, but which indicator family matches the market question being asked.
Definition: In trading, indicators are technical-analysis tools that transform market data into structured readings such as moving averages, oscillator values, volatility bands, breadth measures, support-resistance references, divergence signals, and volume-based activity. They support interpretation, but they do not replace price structure, risk control, or invalidation.
Key Points
- Trading indicators should be grouped by what they measure: trend, momentum, volatility, breadth, volume, support-resistance behavior, or divergence.
- The same market can look different across indicator families because each tool transforms data through a different calculation lens.
- Indicator categories should guide readers toward the right analytical question instead of treating every tool as the same type of signal.
- Weak indicator use usually comes from treating readings as isolated signals rather than checking price structure, participation, and risk context.
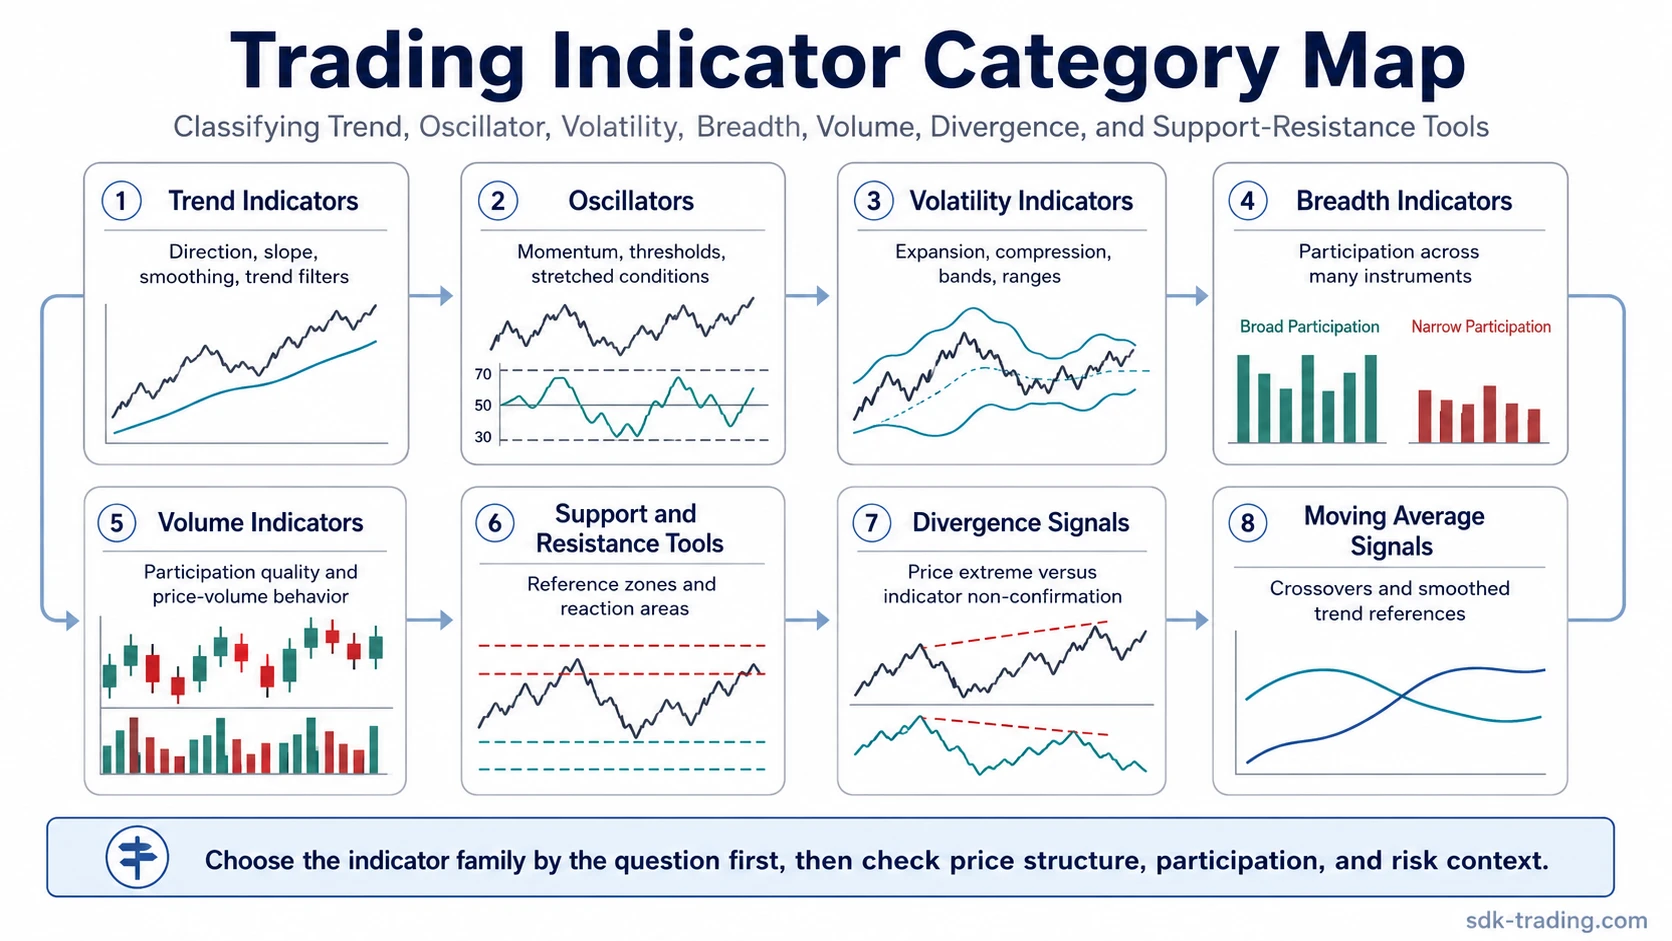
Trading Indicator Route Map
The first decision is the indicator family. A moving-average tool, an oscillator, a volatility measure, and a volume indicator answer different questions. Reading them as interchangeable signals creates false agreement and false conflict.
| Market question | Best route | What the category usually measures |
|---|---|---|
| Is price trending, flattening, or changing direction? | Trend indicators | Trend direction, smoothing, slope, and price location relative to a trend reference. |
| Is momentum stretched, fading, or shifting around a threshold? | Oscillators | Momentum pressure, range position, overbought and oversold behavior, or baseline displacement. |
| Is market movement expanding or compressing? | Volatility indicators | Range expansion, contraction, bands, envelopes, and volatility regime shifts. |
| Is participation broad or concentrated? | Breadth indicators | Market participation across many stocks, sectors, or instruments rather than one chart alone. |
| Where are traders likely to watch reaction zones? | Support and resistance indicators | Reference zones, horizontal levels, pivots, bands, or tools that organize potential reaction areas. |
| Is volume confirming, weakening, or contradicting the price move? | Volume indicators | Participation, accumulation-distribution behavior, volume pressure, and price-plus-volume confirmation. |
| Is price making a new extreme while the indicator fails to confirm? | Divergence signals | Mismatch between price movement and indicator behavior. |
| Is the signal based on trend-following crossover behavior? | Trend and moving average signals | Moving-average crossovers, trend filters, and signal behavior around smoothed price references. |
How Indicator Categories Differ
Indicator categories differ because they compress market data in different ways. A trend indicator may smooth price to reduce noise. An oscillator may normalize movement into a bounded or centered reading. A volatility tool may focus on range behavior. A breadth indicator may ignore one chart and measure participation across a wider market group.
This matters because agreement between indicators is only useful when the tools are not measuring the same thing twice. Two moving averages can create a trend signal, but they do not confirm volume participation. RSI can show momentum pressure, but it does not prove broad market participation. Volume can show activity, but not every volume surge confirms continuation.
Indicator selection rule: Choose the indicator family by the question first. Use trend tools for direction, oscillators for momentum and thresholds, volatility tools for range behavior, breadth tools for participation, volume tools for participation quality, and support-resistance tools for reference zones.
Indicator Cluster Boundaries
Indicator categories should stay separated by analytical job. Detailed definitions, calculations, settings, interpretation limits, and comparison logic belong with the specific indicator or focused indicator family.
| Boundary | Belongs here | Should stay focused |
|---|---|---|
| Category selection | Yes. The main indicator families can be classified here. | No need to explain every individual formula in this overview. |
| Indicator definitions | Only at summary level. | Specific indicator discussions should own the full definition. |
| Calculation details | No. This overview should not become a calculation manual. | Formula, input, and parameter sensitivity belong with the specific indicator. |
| Trading workflow | Only as a safe selection principle. | Workflow, failure modes, and sequencing need focused treatment. |
| Indicator problems | Only as a classification warning. | Weakness, failure, and combination topics need focused explanation. |
Common Indicator Reading Mistakes
A common mistake is using indicator labels without checking the calculation input. Momentum, trend, signal, and confirmation can mean different things depending on the tool. A moving-average crossover, an RSI threshold, a breadth deterioration, and a volume expansion do not carry the same type of evidence.
Another mistake is treating indicators as if they remove uncertainty. Indicators can organize information, but they still lag, overshoot, whipsaw, or produce false confidence when the market regime changes. The safer reading is to ask what the indicator measures, what it ignores, and whether price behavior supports the same interpretation.
Limitation: Indicator agreement is not automatically strong evidence. If several indicators are derived from similar price inputs, they may repeat the same information rather than confirm each other independently.
Related Indicator Starting Points
Some indicator questions are not category questions. A reader may need a beginner route, a broader technical-indicator explanation, a failure-mode page, or a comparison between leading and lagging tools. Those routes should stay separate from the category map.
| Reader need | Best route | Why it is separate |
|---|---|---|
| The reader needs the broader technical-analysis indicator concept. | Technical indicators explained | This is broader than routing through indicator categories. |
| The reader is new to indicator use. | Indicators for beginners | Beginner orientation needs simpler sequencing and fewer assumptions. |
| The reader wants to understand why indicator signals break down. | Why indicators fail | Failure-mode logic should stay focused instead of being buried in the parent route map. |
| The reader is comparing early and delayed indicator behavior. | Leading vs lagging indicators | This is a comparison problem, not a full indicator-family overview. |
| The reader wants a deeper divergence explanation. | Indicator divergence guide | Divergence needs its own price-versus-indicator confirmation logic. |