Technical indicators are calculations that transform market inputs such as price, volume, volatility, open interest, or historical chart data into chart readings. Their usefulness depends less on the name of the indicator and more on what input it repeats, how the formula changes that input, and what the reading can or cannot prove.
In trading analysis, the useful question is not which indicator is popular, but which market input the formula repeats and whether the output adds independent context.
Definition: A technical indicator is a formula-based chart tool that converts existing market data into a reading about trend, momentum, volatility, participation, or structure context. It does not create new market information by itself.
Key Points
- Technical indicators usually transform price, volume, range, open interest, or historical chart data.
- The same market input can appear inside several indicators, which can make agreement look stronger than it is.
- Lag, smoothing, parameter settings, and threshold readings can change how useful an indicator reading is.
- Indicator agreement is more useful when it adds a different type of context, not when it repeats the same data in a different format.
What Technical Indicators Transform
Most technical indicators begin with data already visible on the chart. Price-based indicators transform open, high, low, close, or average price. Volume-based indicators transform activity. Volatility indicators often work from range or price dispersion. Open interest, where available, adds participation context in derivatives markets.
The formula changes how that input is displayed. A moving average smooths price. A momentum oscillator compares recent price behavior against prior behavior. A volatility measure may expand when ranges widen. The output can be useful, but it remains a transformed reading of the underlying input.
Smoothing tools such as the exponential moving average reduce noise by weighting recent prices more heavily than older prices. That makes the line easier to read, but it can also delay recognition when price behavior changes quickly.
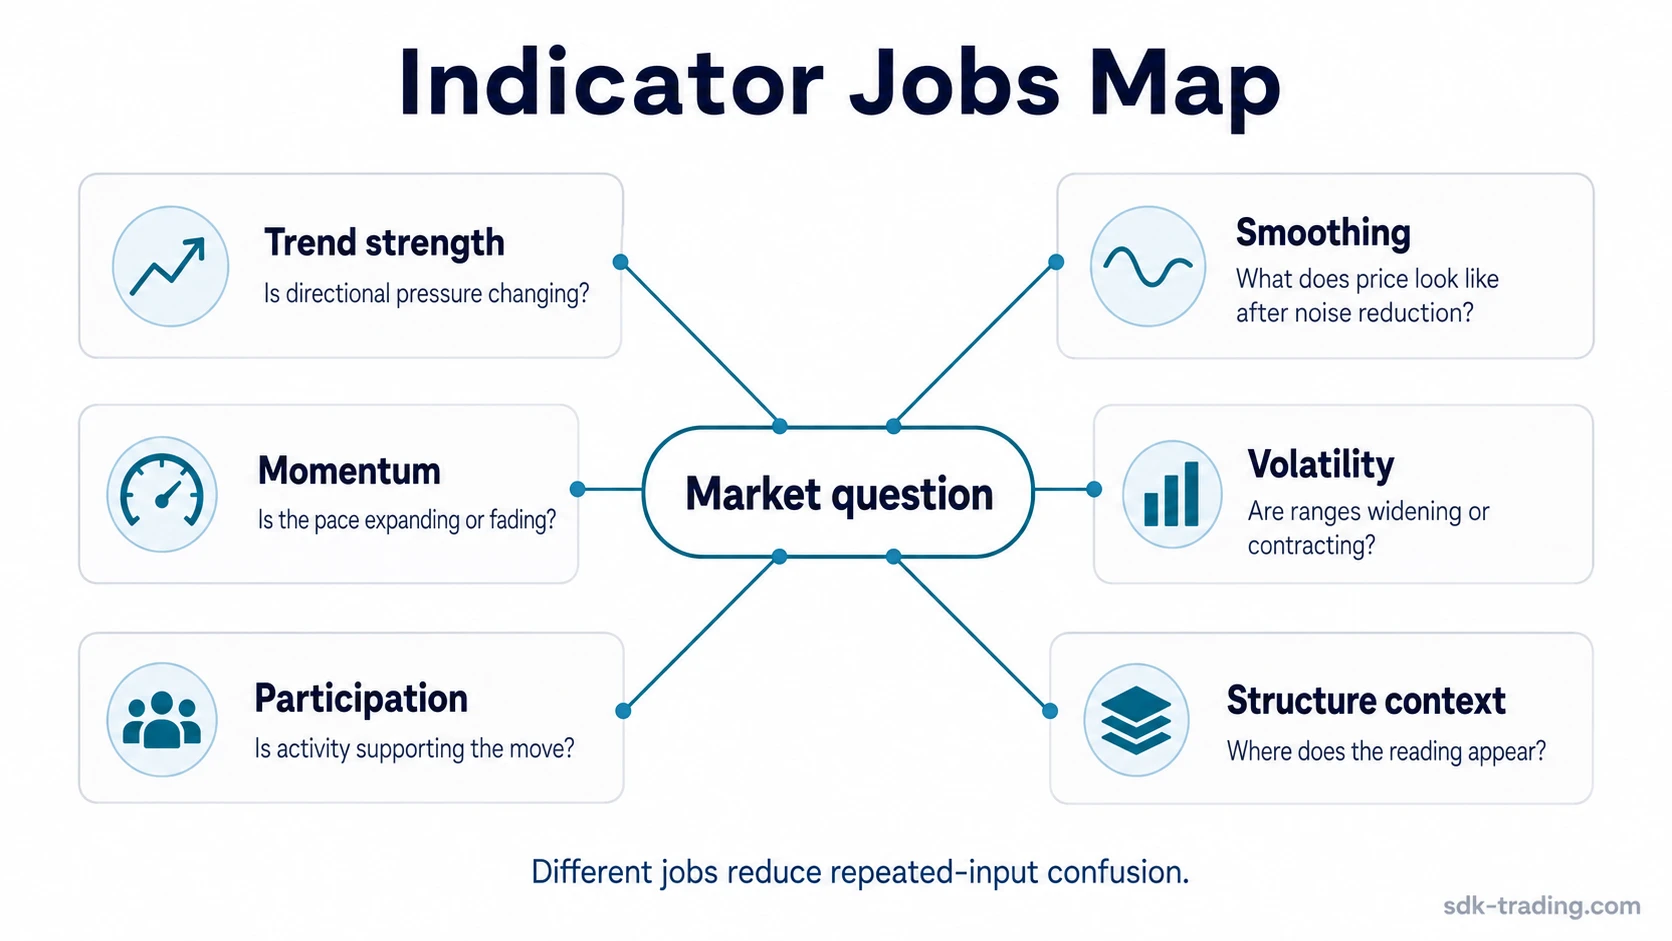
Indicator Jobs, Not Indicator Rankings
Technical indicators are easier to compare by market job than by popularity. A trend tool, a volatility tool, and a participation tool answer different questions. Ranking them as generally stronger or weaker can hide the more important issue: whether the tool adds a different type of context.
| Indicator job | Question it helps frame | Common examples |
|---|---|---|
| Trend strength | Is directional pressure strengthening, weakening, or unclear? | ADX, directional movement tools |
| Smoothing | How does recent price compare with a smoothed reference? | EMA, SMA |
| Momentum | Is the pace of movement expanding or fading? | RSI, MACD, rate-of-change tools |
| Volatility | Are ranges expanding, contracting, or shifting regime? | ATR, Bollinger-style range tools |
| Volume or participation | Is activity supporting, contradicting, or complicating the price move? | Volume averages, volume-derived tools |
| Structure context | Where does the reading appear relative to a tested area, trend, or range? | Chart structure, support and resistance context |
Trend-strength readings such as average directional index can help separate trend strength from simple price movement. The reading still needs context because a strong trend measure does not explain whether the move is extended, accepted, or vulnerable to failed follow-through.
Input, Output, Common Misread, Safer Reading
A useful indicator interpretation starts with the input. The output is only the visible result of a formula. Misreads usually happen when the output is treated as independent evidence without checking the data behind it.
| Indicator or group | Main input | Transformed output | Common misread | Safer interpretation |
|---|---|---|---|---|
| EMA | Recent closing prices | Smoothed price reference with heavier recent weighting | Reading a slope change as proof that trend has changed | Compare the slope with price acceptance, pullback behavior, and whether the market holds the new area. |
| ADX | Directional movement and range data | Trend-strength reading | Treating strength as direction or as a complete trading decision | Separate strength from direction, then compare the reading with price structure and follow-through. |
| RSI-style momentum | Recent price gains and losses | Momentum oscillator | Assuming an extreme reading automatically means reversal | Check whether the market is trending, ranging, rejecting a level, or accepting new prices. |
| MACD-style momentum | Moving-average relationships | Momentum and moving-average spread reading | Treating a crossover as independent proof | Recognize that the reading is derived from moving averages and may repeat price-smoothing behavior. |
| ATR-style volatility | Range expansion and contraction | Volatility estimate | Reading higher volatility as directional conviction | Use it to describe range behavior, then separate volatility from trend direction or participation. |
| Volume-derived tools | Trading activity | Participation or activity reading | Assuming more activity always validates the move | Compare activity with price result, close location, prior structure, and later testing. |
| Shared-input check | Repeated price, volume, or range data | Several aligned readings from similar source behavior | Counting repeated input as separate confirmation | Check whether each tool adds a different market question or only repackages the same move. |
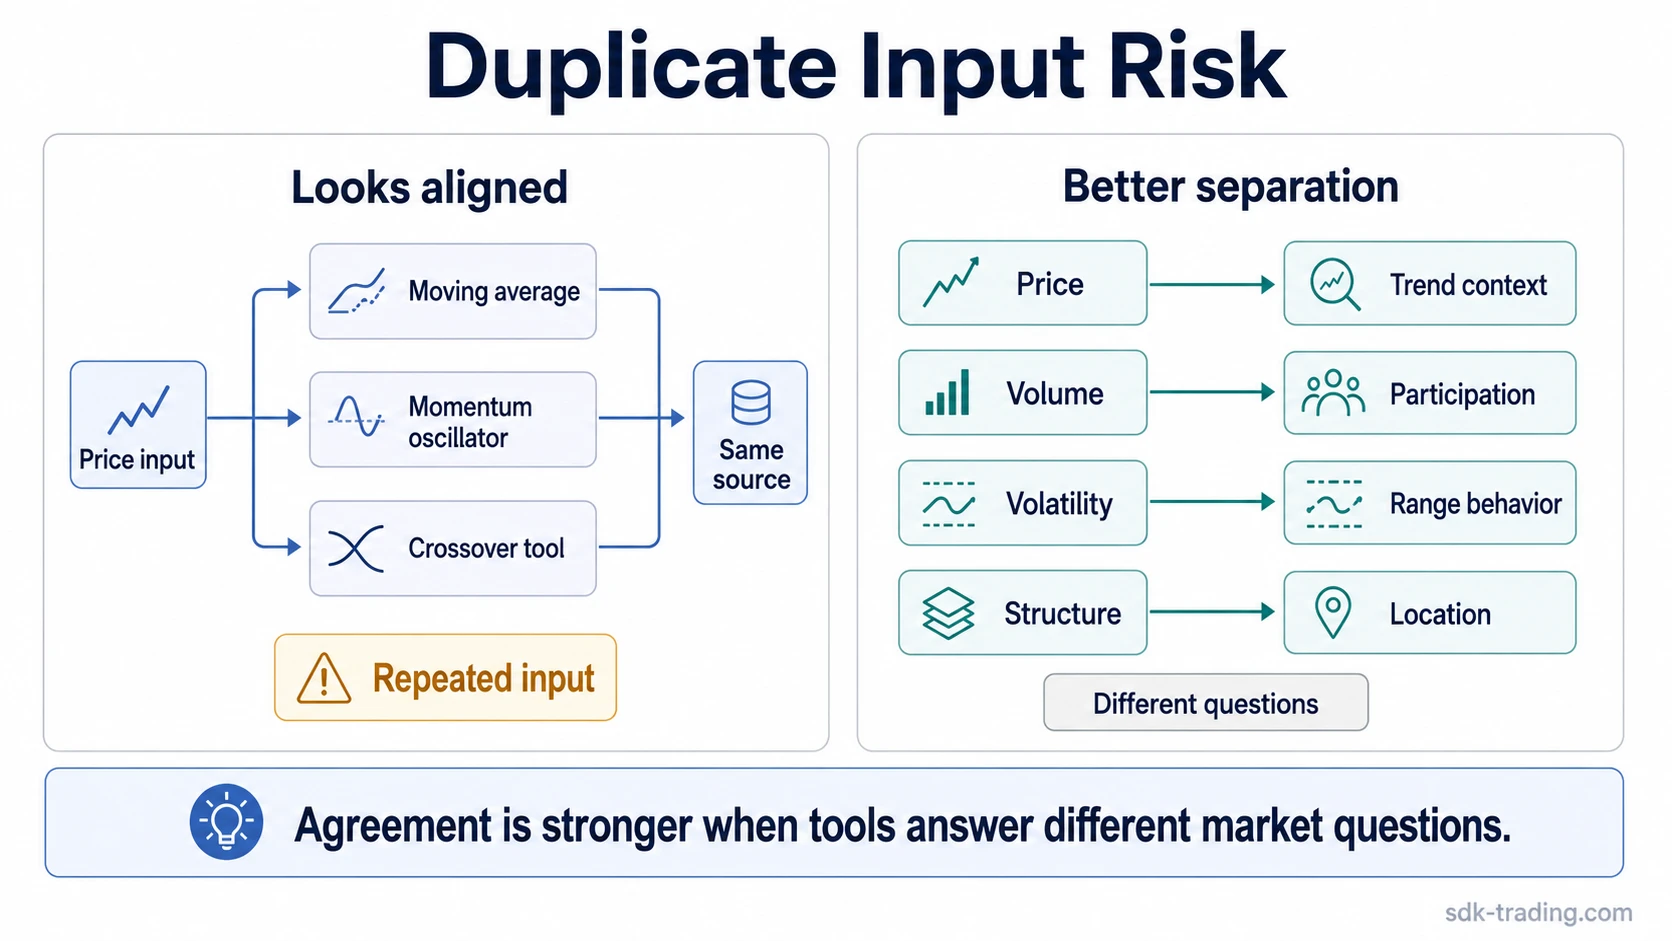
Why Several Indicators Can Agree and Still Add Little
Indicator agreement is not automatically independent confirmation. Several tools can react to the same price expansion, the same closing sequence, or the same volatility burst. The chart may look confirmed because multiple panels point in the same direction, while the underlying evidence still comes from one source.
Duplicate-input risk: Agreement is weaker when two or more indicators mainly repackage the same price or volume data. The question is not only whether readings align, but whether each reading adds a different type of information.
A moving average turning upward, a momentum oscillator rising, and a volatility measure expanding can all appear after a strong price move. That agreement may be useful as a description of the move, but it does not prove that the next move is already resolved.
Where Technical Indicators Become Misleading
Lag is the first limitation. Many indicators need completed price data before the formula updates. A cleaner line or oscillator can make interpretation easier, but the smoother output usually arrives after part of the move has already occurred.
Parameter sensitivity is another limitation. A short setting may react quickly but create more noise. A longer setting may reduce noise but respond late. Neither setting is inherently more reliable without knowing the market condition being measured.
Threshold labels can also create false precision. Overbought, oversold, high volatility, low volatility, rising trend strength, or falling momentum are descriptive states. They need surrounding price, volume, volatility, and structure before the interpretation becomes meaningful.
Common mistake: Treating agreement between multiple indicators as independent confirmation when they share the same source data. The interpretation weakens if each tool is only restating recent price movement through a different formula.
A Technical Indicator Example in Context
Price advances quickly out of a range, the moving average turns upward, a momentum oscillator rises, and volatility expands. The alignment looks persuasive at first because several readings changed together.
The incomplete part is the source of the agreement. The moving average and momentum oscillator may both be reacting mainly to the same recent price expansion, while the volatility measure may only confirm that the range widened. The reading is more useful when it adds context that is not just another version of the same price move, such as whether price accepts the higher area, whether participation supports the move, and whether later pullbacks hold without immediate rejection.
If price quickly falls back into the prior range and the next recovery attempt stalls, the earlier agreement becomes less useful. The issue is not that indicators failed mechanically. The issue is that the readings described movement before the market showed durable acceptance.
How to Read Indicator Agreement More Safely
Indicator agreement is more useful when each tool answers a different question. A trend-strength reading, a volatility reading, and a participation reading can be complementary when they measure different behavior. Three price-smoothing tools that all react to the same closing sequence may be less informative.
A practical interpretation sequence starts with the market input, then the formula behavior, then the chart context. First, identify what the indicator measures. Next, ask whether the formula adds clarity or only smooths what price already shows. Then compare the result with structure, follow-through, and later acceptance or rejection.
That sequence keeps the interpretation conditional. Indicators can help organize chart information, but they cannot remove uncertainty, predict the next price move, or replace the need to compare evidence across price behavior, volume, volatility, and structure.
FAQ
Are technical indicators predictive?
Technical indicators are descriptive calculations based on existing or historical market data. They can help organize trend, momentum, volatility, or participation context, but they do not predict the next price move by themselves.
Why can indicator agreement be misleading?
Indicator agreement can be misleading when several tools use the same underlying input. A moving average, oscillator, and crossover tool may all react to the same recent price movement rather than provide independent evidence.
Is lag always bad in technical indicators?
Lag is not always bad. Smoothing can reduce noise and make a reading easier to interpret, but the trade-off is slower response when market behavior changes quickly.
Why does price structure change an indicator reading?
Price structure changes an indicator reading because the same value can mean different things in a trend, range, failed breakout, retest, or rejection. Location, acceptance, and follow-through affect the interpretation.