Candlestick patterns are chart formations built from one or more candles that show how open, high, low, and close prices relate inside a market move. They can be grouped by structure, such as single-candle, double-candle, triple-candle, continuation, and gap-based patterns, and by interpretation, such as bullish, bearish, reversal, continuation, or indecision readings.
Definition: A candlestick pattern is a price-chart structure formed by one or more candles. The structure is read through the real body, upper wick, lower wick, open, high, low, close, gaps, overlap, sequence, and follow-through.
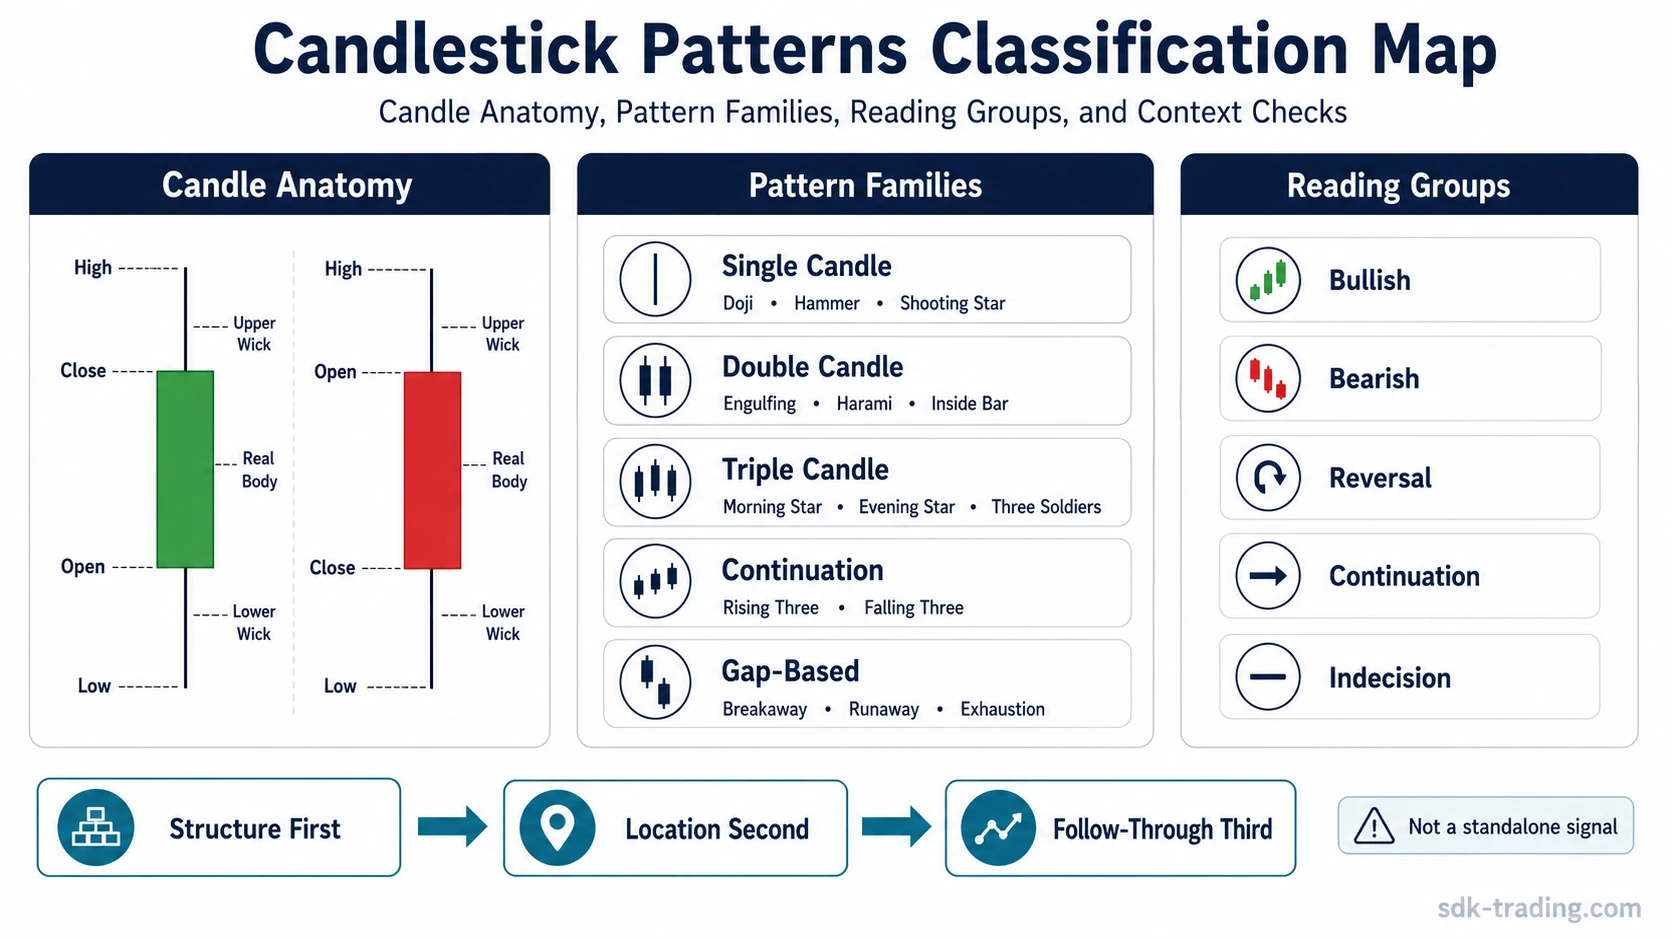
A useful candlestick reading starts with the candle structure first, then checks chart location, prior trend, support or resistance, volume context, and follow-through. A pattern name alone is not enough to define a trade signal.
Key Points
- Candlestick patterns should first be classified by structure: single candle, double candle, triple candle, continuation, or gap-based formation.
- The same candlestick shape can mean different things at support, at resistance, inside a trend, after a gap, or in the middle of a range.
- Single-candle patterns focus on body size, wick behavior, close location, and rejection inside one candle.
- Multi-candle patterns depend on how candles overlap, engulf, compress, follow through, or form a sequence.
- A cleaner candlestick reading moves from structure to chart location to follow-through instead of treating a pattern label as a standalone signal.
How a Candlestick Is Built
Every candlestick starts with four prices: open, high, low, and close. The real body shows the distance between open and close. The upper and lower shadows show how far price moved beyond the body before the candle closed. These parts matter because pattern names are only shorthand for the underlying candle structure.
| Candle part | What it shows | Why it matters |
|---|---|---|
| Open | The first traded price of the candle period. | Creates the starting reference for the candle body. |
| High | The highest price reached during the candle period. | Shows the upper extreme before the candle closed. |
| Low | The lowest price reached during the candle period. | Shows the lower extreme before the candle closed. |
| Close | The final traded price of the candle period. | Shows where price finished relative to the candle range. |
| Real body | The distance between open and close. | Helps show whether the candle closed with strong, weak, or balanced pressure. |
| Upper wick | The distance from the body to the high. | Shows how far price moved higher before closing below the high. |
| Lower wick | The distance from the body to the low. | Shows how far price moved lower before closing above the low. |
| Close location | Where the close sits inside the full candle range. | Helps separate rejection, continuation, hesitation, and weak follow-through. |
Candlestick Pattern Types
Candlestick patterns can be grouped by the number of candles involved and by the market behavior they describe. The structural grouping helps identify what is on the chart. The interpretation grouping helps avoid reading every pattern as the same kind of signal.
| Pattern type | What it describes | Common examples |
|---|---|---|
| Single candlestick patterns | One candle’s body, wick, close location, and rejection behavior. | Doji, hammer, shooting star, spinning top, marubozu. |
| Double candlestick patterns | The relationship between two candles, including engulfing, containment, overlap, and rejection. | Bullish engulfing, bearish engulfing, harami, inside bar, outside bar. |
| Triple candlestick patterns | A three-candle sequence that shows transition, pressure change, or continuation. | Morning star, evening star, three white soldiers, three black crows. |
| Continuation candlestick patterns | A pause, retracement, or compression inside an existing directional move. | Rising three methods, falling three methods, mat hold, tasuki gap. |
| Gap candlestick patterns | A structure where the space between candles changes the interpretation. | Breakaway gap, runaway gap, exhaustion gap, island reversal. |
Most Common Candlestick Patterns
The most common candlestick patterns are better treated as entry points into pattern families, not as isolated trading instructions. The same candle shape can mean different things depending on trend location, support or resistance, volume background, and the next candle’s response.
| Pattern | Family | Basic reading question |
|---|---|---|
| Doji | Single | Did open and close finish near the same level? |
| Hammer | Single | Did price reject lower levels after downside pressure? |
| Inverted hammer | Single | Did price test higher levels after prior downside pressure? |
| Shooting star | Single | Did price reject higher levels after upside pressure? |
| Hanging man | Single | Did a lower rejection candle appear after an advance? |
| Spinning top | Single | Did the candle show balance or hesitation? |
| Marubozu | Single | Did one side control most of the candle range? |
| Dragonfly doji | Single | Did price reject lower levels and close near the open? |
| Gravestone doji | Single | Did price reject higher levels and close near the open? |
| Bullish engulfing | Double | Did the second candle overtake the prior bearish body? |
| Bearish engulfing | Double | Did the second candle overtake the prior bullish body? |
| Bullish harami | Double | Did a smaller candle contract inside a prior bearish body? |
| Bearish harami | Double | Did a smaller candle contract inside a prior bullish body? |
| Inside bar | Double | Did price compress inside the prior candle range? |
| Outside bar | Double | Did the second candle expand beyond the prior candle range? |
| Tweezer top | Double | Did two candles reject a similar upper area? |
| Tweezer bottom | Double | Did two candles reject a similar lower area? |
| Morning star | Triple | Did downside pressure pause and then recover? |
| Evening star | Triple | Did upside pressure pause and then weaken? |
| Three white soldiers | Triple | Did three candles show sustained upward follow-through? |
| Three black crows | Triple | Did three candles show sustained downward follow-through? |
| Rising three methods | Continuation | Did price pause inside an existing upward structure? |
| Falling three methods | Continuation | Did price pause inside an existing downward structure? |
| Breakaway gap | Gap-based | Did price gap away from a prior range or base? |
| Runaway gap | Gap-based | Did price gap in the direction of an existing move? |
| Exhaustion gap | Gap-based | Did a late gap appear after an extended move? |
| Island reversal | Gap-based | Did two gaps isolate a candle group from nearby price action? |
This table is a routing overview. Each named pattern still needs its own context, location, and confirmation checks before it can be interpreted with any discipline.
Bullish, Bearish, Reversal, Continuation, and Indecision Readings
Candlestick patterns are often described as bullish or bearish, but that label is only a starting point. A bullish pattern usually matters more after prior downside pressure. A bearish pattern usually matters more after prior upside pressure. Continuation patterns need an existing trend. Indecision candles need context before they can be interpreted.
| Reading group | What it usually describes | What to check before relying on it |
|---|---|---|
| Bullish patterns | Possible demand response after downside pressure. | Prior decline, support area, close strength, and follow-through. |
| Bearish patterns | Possible supply response after upside pressure. | Prior advance, resistance area, close weakness, and follow-through. |
| Reversal patterns | A possible change in pressure. | Location, exhaustion, failed continuation, and next-candle confirmation. |
| Continuation patterns | A pause or compression inside an existing move. | Whether the broader trend structure remains intact. |
| Indecision patterns | Temporary balance, hesitation, or reduced directional control. | Whether the next candles break the balance with acceptance. |
| Interpretation question | Relevant page |
|---|---|
| The main issue is the directional distinction between bullish and bearish structures. | Bullish vs bearish candlestick patterns |
| The main issue is how candlestick behavior appears in crypto-market examples or use cases. | Crypto candlestick patterns |
| The main issue is swing-trading context rather than broad pattern classification. | Candlestick patterns for swing trading |
How to Read Candlestick Patterns Without Overreading Them
A cleaner candlestick process separates structure from interpretation. The pattern name is not the first decision. The first decision is what the candles actually show.
| Step | Question | Purpose |
|---|---|---|
| 1. Count the candles | Is the structure made from one, two, three, or more candles? | Separates single, double, triple, continuation, and gap-based families. |
| 2. Identify the structure | Is the key feature body size, wick rejection, overlap, engulfing, sequence, or gap? | Prevents forcing the wrong pattern name onto the chart. |
| 3. Check the location | Is the pattern at support, resistance, a trend pause, a gap area, or a range middle? | Shows whether the same candle shape has useful context. |
| 4. Check follow-through | Does the next candle confirm, reject, or neutralize the reading? | Reduces the risk of treating a single candle as enough evidence. |
| 5. Choose the correct concept layer | Is the issue a pattern family, a named pattern, a mistake, or reliability question? | Keeps the analysis focused instead of treating every candle as the same type of evidence. |
Choose the Right Candlestick Pattern Family
A hammer, engulfing pattern, morning star, falling three methods pattern, and runaway gap all use candlestick structure, but they are read through different pattern families. The table below separates those paths by the kind of candle evidence involved.
| Structure question | Pattern family | What that family covers |
|---|---|---|
| Is the pattern formed by one candle only? | Single candlestick patterns | Doji, hammer, shooting star, marubozu, pin bar, rejection candle, long wick, and other one-candle structures. |
| Does the pattern depend on the relationship between two candles? | Double candlestick patterns | Engulfing, harami, inside bar, outside bar, tweezer, piercing pattern, and related two-candle formations. |
| Does the pattern require a three-candle sequence? | Triple candlestick patterns | Morning star, evening star, three white soldiers, three black crows, three inside and three outside structures. |
| Is the pattern mainly about trend pause and continuation structure? | Continuation candlestick patterns | Pattern families where price pauses, compresses, or retraces without automatically changing the broader direction. |
| Does the pattern depend on a price gap between candles? | Gap candlestick patterns | Breakaway, runaway, exhaustion, island reversal, tasuki, and other gap-based candlestick structures. |
When the Issue Is Not a Pattern Name
Some candlestick questions are not asking for another list of names. They are about how candles are built, how patterns are read, why similar structures are confused, or why a pattern becomes weak when the surrounding chart does not support it.
| Interpretation problem | Relevant page | Use when |
|---|---|---|
| The basic concept is needed before choosing a pattern family. | Candlestick patterns explained | The issue is definition, candle anatomy, and why patterns exist as a classification system. |
| The main task is reading candle structure from a chart. | How to read candlestick charts | The question is about open, high, low, close, real body, shadows, and chart-reading sequence. |
| The problem is overreading isolated candles or forcing pattern names onto weak structure. | Common candlestick mistakes | The problem is false recognition, wrong context, or reading a pattern without enough structural evidence. |
| The issue is whether candlestick patterns are dependable. | Candlestick pattern reliability | The issue is confirmation, false readings, sample context, and limits of pattern-only interpretation. |
| The issue is discovery across widely used pattern names. | Most popular candlestick patterns | The question is discovery-oriented and should connect to the strongest named pattern pages. |
Why Candlestick Patterns Need Context
A candlestick pattern is not a complete trading system. The same shape can mean different things at support, at resistance, inside a trend, after a gap, or in the middle of a range. The pattern becomes more useful when structure, location, volume, and follow-through support the reading.
This is why broad candlestick analysis should not stop at pattern recognition. Classification comes first. Specific pattern interpretation comes second. Reliability, mistakes, and use-case pages become useful only after the correct pattern family is clear.
Candlestick Patterns FAQ
What are candlestick patterns?
Candlestick patterns are price-chart formations built from one or more candles. They organize open, high, low, close, body, wick, gap, overlap, sequence, and follow-through behavior into recognizable chart structures.
What are the main types of candlestick patterns?
The main structural types are single-candle patterns, double-candle patterns, triple-candle patterns, continuation patterns, and gap-based candlestick patterns.
Are candlestick patterns bullish or bearish signals?
Some patterns are commonly labeled bullish or bearish, but the label is not enough by itself. Location, prior trend, support or resistance, volume context, and follow-through change the interpretation.
What are the most common candlestick patterns?
Common candlestick patterns include doji, hammer, shooting star, spinning top, marubozu, bullish engulfing, bearish engulfing, harami, morning star, evening star, three white soldiers, and three black crows.
How should candlestick patterns be read?
A disciplined reading starts by identifying the candle structure, then checking chart location, prior trend, support or resistance, volume context, and follow-through. The pattern name should not be treated as a complete signal by itself.