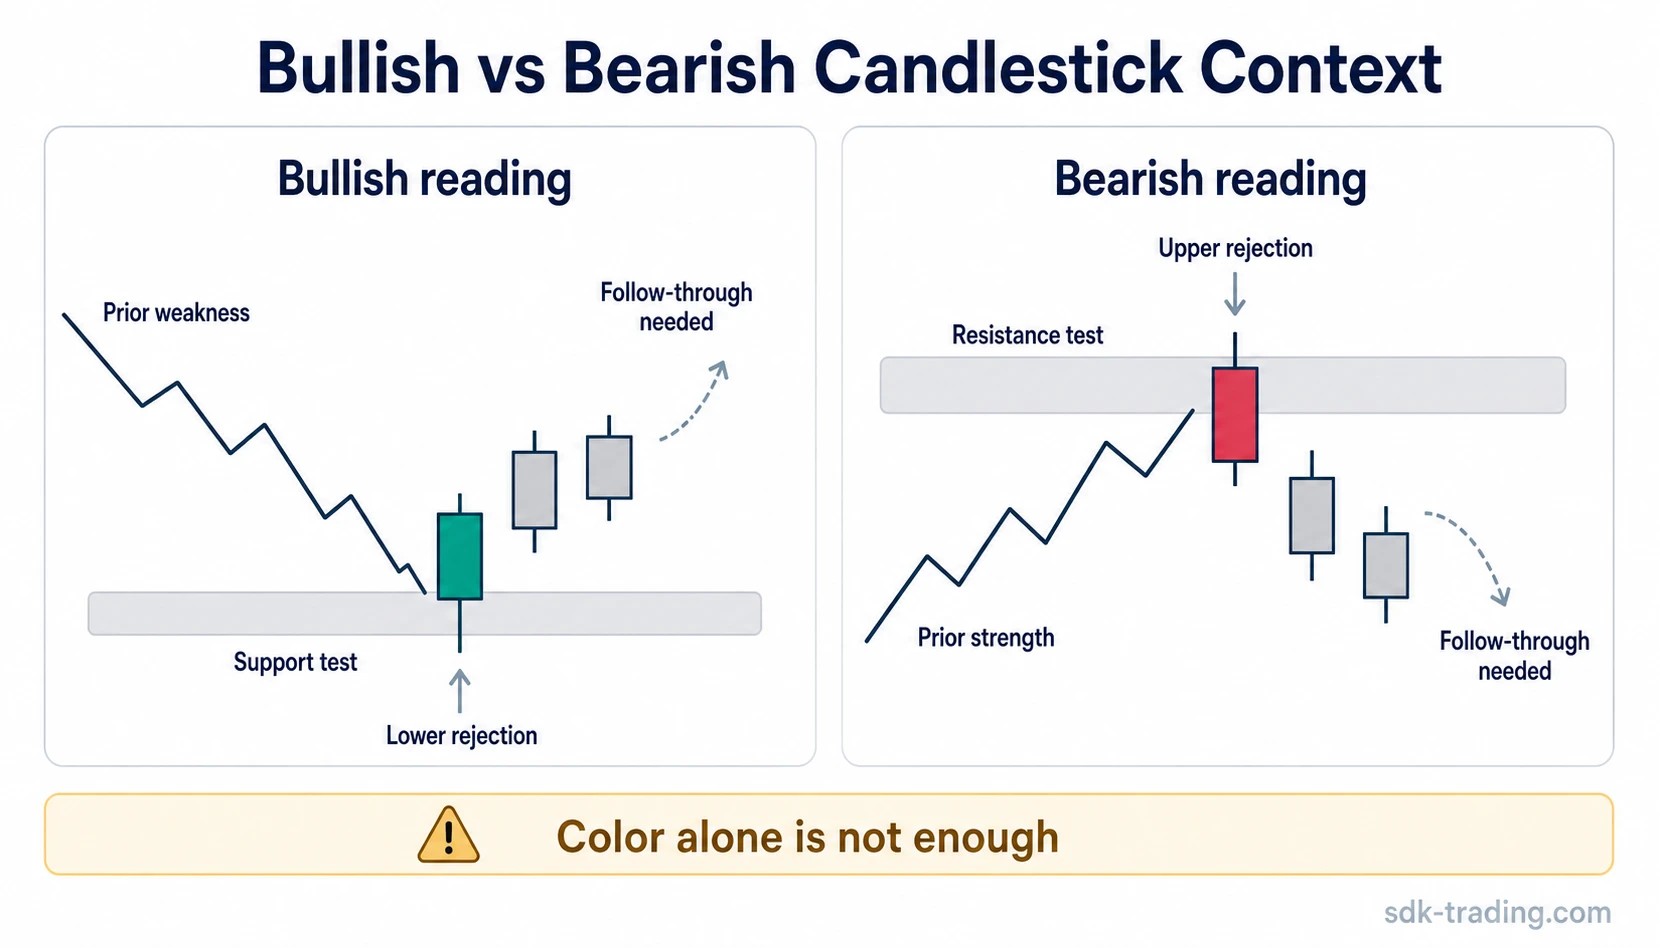
Bullish and bearish candlestick patterns describe pressure in opposite directions, but the candle label is only the first clue. A bullish reading usually depends on demand pressure, failed lower acceptance, or rejection near support. A bearish reading usually depends on supply pressure, failed higher acceptance, or rejection near resistance. Prior movement, location, close position, and follow-through decide whether the pattern is a reversal attempt, continuation pause, or unresolved warning.
The same candle shape can carry a different reading after a decline into support than after an extended advance. The same bearish-looking candle can warn of rejection near resistance, or it can simply continue weakness that was already present.
The Key Difference Between Bullish and Bearish Candlestick Patterns
A bullish candlestick pattern becomes more meaningful when price rejects lower levels, closes with stronger demand, or holds above a reaction area after prior weakness. The candle is not bullish in a useful way only because it is green.
A bearish candlestick pattern becomes more meaningful when price rejects higher levels, closes with stronger supply, or fails to recover after prior strength. The candle is not bearish in a useful way only because it is red.
The practical difference is not only candle color. Body size, wick direction, close location, and later acceptance all matter. A strong green close near the high usually carries a different message from a green candle with a long upper wick and weak close. A red candle near the low usually carries a different message from a red candle that rejects lower prices and closes back inside the prior range.
Bullish vs Bearish Pattern Criteria
| Question | When the reading leans bullish | When the reading leans bearish | Common misread to avoid |
|---|---|---|---|
| What happened before the pattern? | Prior weakness can make lower rejection more meaningful. | Prior strength can make upper rejection more meaningful. | Reading candle color without the prior move. |
| Where did the pattern form? | Support, a lower range edge, or a failed push lower can support a bullish reading. | Resistance, an upper range edge, or a failed push higher can support a bearish reading. | Treating any green candle as bullish confirmation or any red candle as bearish confirmation. |
| Where did the candle close? | A close near the high supports demand pressure. | A close near the low supports supply pressure. | Ignoring a weak close, upper wick rejection, or lower wick rejection. |
| What followed the candle? | Later candles holding above the reaction area make the bullish reading more defensible. | Later candles failing below the rejected area make the bearish reading more defensible. | Treating the first candle as confirmation before the market shows acceptance. |
Same Candle Shape, Different Prior Trend
A green candle with a firm close after a decline into a support area can suggest that sellers failed to keep control. The same green candle after an extended advance may be less useful if it appears after several stretched candles and cannot hold higher prices afterward.
A red candle with a weak close after an advance into resistance can suggest failed higher acceptance. The same red candle inside an already weak decline may only show that existing selling pressure continued, not that a fresh bearish reversal has appeared.
| Candle appearance | Prior context | More useful reading | Risk of misread |
|---|---|---|---|
| Bullish-looking candle | Decline into support | Possible lower rejection if price later holds above the reaction area. | Calling it confirmed before follow-through appears. |
| Bullish-looking candle | Extended advance | Continuation is possible only if price holds higher levels instead of rejecting them. | Ignoring exhaustion risk after a stretched move into weaker follow-through. |
| Bearish-looking candle | Advance into resistance | Possible upper rejection if recovery attempts fail below the rejected area. | Treating one weak candle as a complete reversal. |
| Bearish-looking candle | Existing decline | Continuation of weakness unless lower prices are rejected. | Assuming every red candle starts a new bearish phase. |
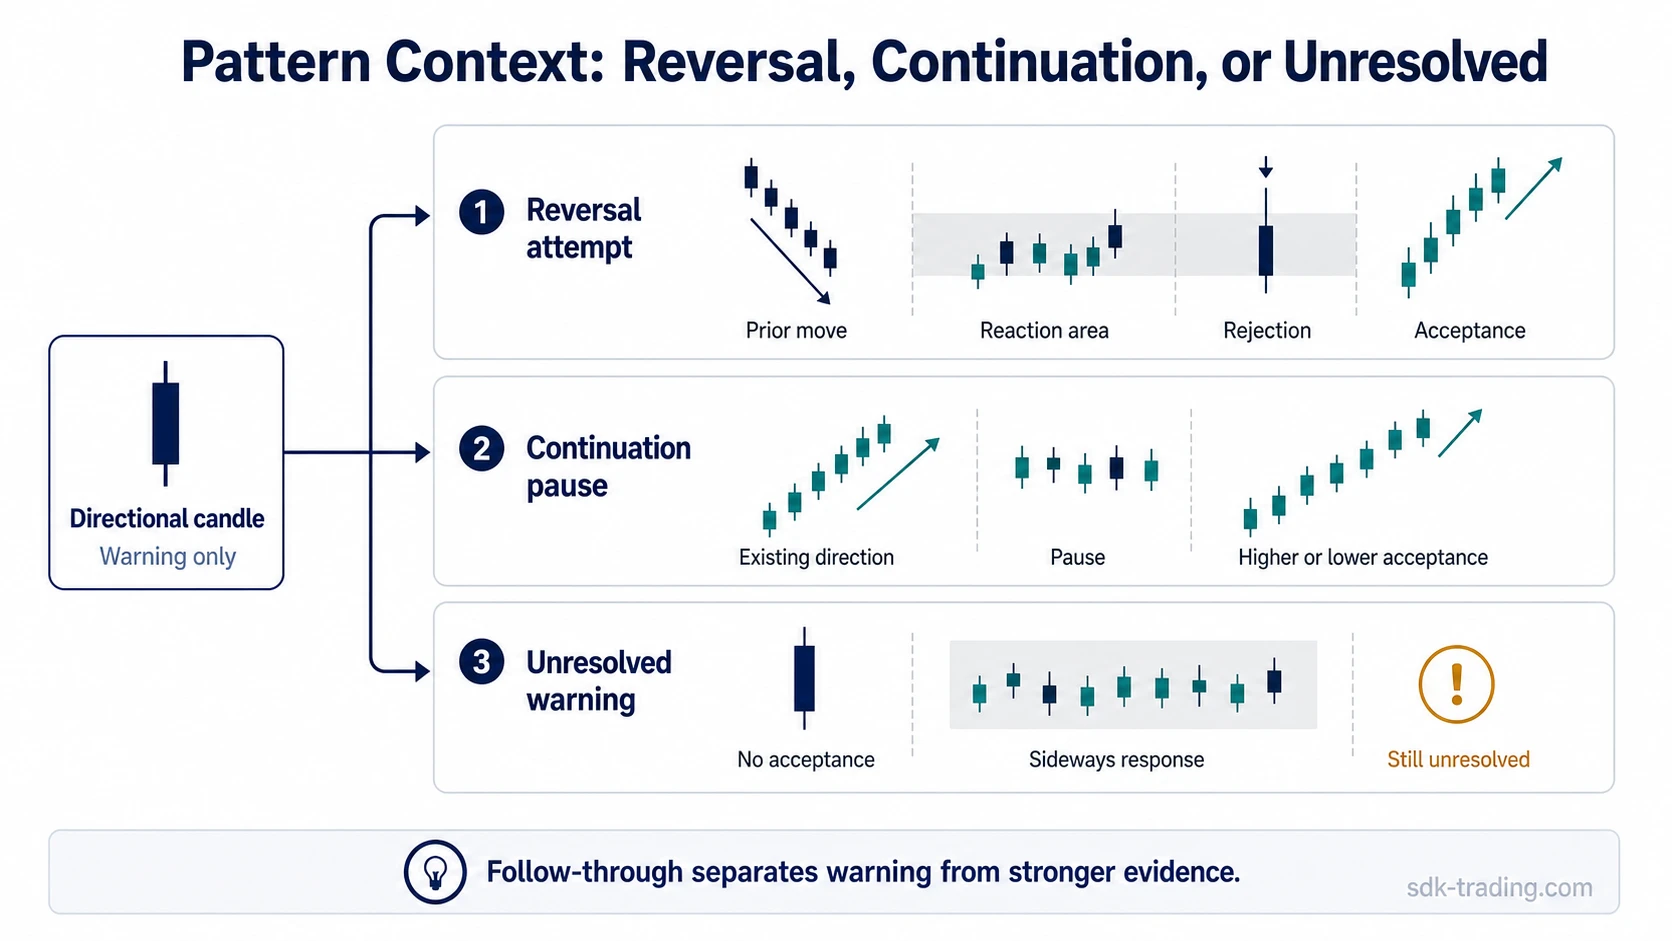
Reversal, Continuation, and Unresolved Context
A reversal reading depends on a failed continuation of the prior move. A bullish reversal attempt usually needs prior weakness, a lower test, rejection, and later acceptance above the reaction area. A bearish reversal attempt usually needs prior strength, an upper test, rejection, and later acceptance below the rejected area.
A continuation reading depends on the pattern appearing as a pause inside an existing directional move. A bullish continuation reading is cleaner when the pause holds above the prior reaction area and later trades with acceptance at higher levels. A bearish continuation reading is cleaner when recovery attempts stall and later candles spend more time at lower levels.
An unresolved context appears when the candle looks directional, but later candles do not confirm acceptance in either direction. Sideways movement after a bullish or bearish candle can leave the pattern as a warning, not a completed interpretation.
What Can Mislead the Reading
Color-only reading is the most common mistake. A green candle is not automatically bullish in a useful way, and a red candle is not automatically bearish in a useful way. The market can close green after rejecting higher prices, or close red after rejecting lower prices.
Location can change the meaning more than the candle name. A bullish-looking candle near support has a different job from the same candle after a long advance. A bearish-looking candle near resistance has a different job from the same candle after selling pressure is already established.
Follow-through separates early warning from stronger evidence. Without later acceptance, the candle remains only part of the reading. The next few candles often decide whether the pattern was rejection, continuation, or only a pause.
Double-Candle Examples of Context Dependence
Double-candle patterns can make context easier to compare because the second candle shows how price responds after the first candle. A bearish harami can matter more after prior strength because the smaller second candle shows hesitation after an advance.
A bullish harami can matter more after prior weakness because the smaller second candle shows selling pressure has paused. In both cases, the pattern name is only the starting point; location and later acceptance still decide the quality of the reading.
Frequently Asked Questions
Can the same candlestick shape have different bullish or bearish readings?
Yes. A bullish-looking candle after a decline into support can suggest lower rejection, while the same candle after an extended advance may only show temporary strength. Prior trend and location decide the useful reading.
When is a bullish candle reading reversal rather than continuation?
A bullish reversal reading needs prior weakness or a lower-area test. A bullish continuation reading needs existing strength and later acceptance that keeps the prior structure intact.
What matters more, candle color or location?
Location usually carries more diagnostic value than color alone. Candle color can describe the close, but support, resistance, wick rejection, close position, and follow-through explain whether the reading has stronger context.