Position sizing in trading determines how many shares, contracts, lots, or other units fit inside a predefined amount of risk. In a simple price-based trade, the calculation connects the planned capital loss with the distance between the entry reference and the loss boundary.
Definition: Position sizing converts a risk budget and the risk carried by one unit of a trade into an exposure amount. The resulting size controls how much account capital is attached to the position.
The calculation is only the first layer. Existing positions, concentration, instrument mechanics, volatility, and execution assumptions can make the final allowable exposure smaller than the base mathematical result.
Key Points
- A basic position-size calculation starts with the planned risk amount and risk per unit.
- For a simple price-based trade, position size equals planned risk amount divided by risk per unit.
- When planned capital risk stays constant, a wider loss boundary produces a smaller base position.
- The calculated size may still need adjustment for concentration, existing exposure, instrument mechanics, and execution costs.
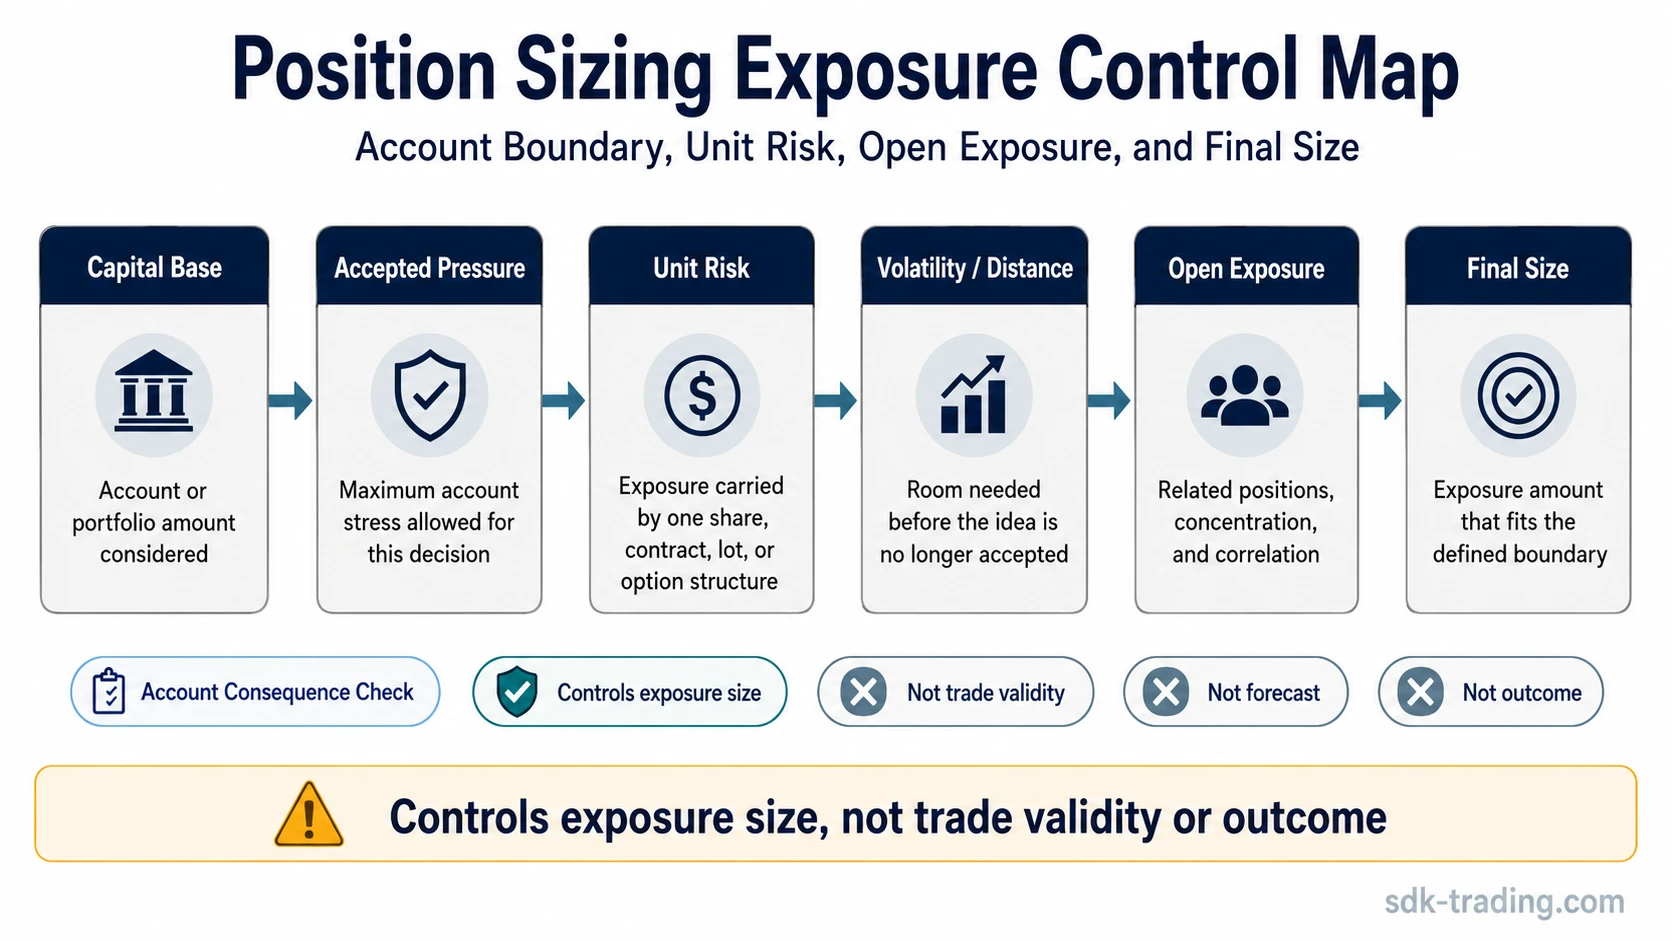
- Position sizing controls account exposure. The quality of the market idea is evaluated separately.
How to Calculate Position Size
Start with the amount of capital the trade is allowed to lose under the plan. Then measure the loss attached to one unit if price reaches the predefined loss boundary.
Basic formula: Position size = planned risk amount / risk per unit
For a simple stock position, risk per share can be measured from the entry reference to the stop price:
Risk per share: | entry price – stop price |
Position size in shares: planned dollar risk / risk per share
When the risk amount is based on a fraction of account capital, that input can be calculated first:
Planned risk amount: account capital × chosen risk fraction
The formula processes the selected inputs. It does not choose the appropriate risk fraction or decide where the loss boundary belongs.
Illustrative calculation: Assume the planned risk amount is $100, the entry reference is $50, and the stop is $48. The risk per share is $2. Dividing $100 by $2 gives a base position size of 50 shares.
This simplified calculation assumes the planned loss can be represented by the entry-to-stop distance. Fees, spread, slippage, gaps, contract multipliers, and other instrument-specific features can change the realized exposure.
Why Stop Distance Changes Position Size
Risk per unit increases as the distance between entry and the loss boundary becomes wider. If the planned dollar risk remains unchanged, fewer units can fit inside that same risk budget.
| Planned risk amount | Risk per unit | Base position size |
|---|---|---|
| $100 | $1 | 100 units |
| $100 | $2 | 50 units |
| $100 | $5 | 20 units |
A narrow stop therefore permits more units mathematically, while a wider stop permits fewer. That arithmetic says nothing about which boundary is appropriate. The trade structure determines the boundary first, and the sizing calculation responds to the risk created by that boundary.
Sequence: Define the loss boundary, measure the risk per unit, then calculate the number of units. Choosing the desired position size first can distort the boundary used in the calculation.
Base Position Size and Final Allowable Exposure
The basic formula answers one narrow question: how many units fit inside the selected trade-level risk amount under the assumptions used in the calculation.
The account-level decision comes next. A mathematically valid 50-share position may still be too large if the portfolio already carries substantial exposure to the same sector, factor, currency, or broad market move. Contract rules, leverage, liquidity, and transaction costs can also change what those 50 units mean in practice.
| Layer | What is being checked | Possible effect |
|---|---|---|
| Base calculation | Risk amount divided by risk per unit | Produces the initial unit count. |
| Existing exposure | Risk already active elsewhere in the account | May reduce the additional size that fits the account. |
| Concentration | Dependence on the same sector, market, or risk driver | May make several separate positions behave like one larger exposure. |
| Instrument mechanics | Contract multipliers, lots, leverage, margin, premium, or other structural features | Can change the economic exposure behind the visible unit count. |
| Execution | Spread, fees, slippage, gaps, and liquidity | Can make realized loss larger than the clean formula assumes. |
Account-level distinction: The formula produces a base size for one trade. Final allowable exposure also depends on what that position adds to the rest of the account.
What Shapes Position Size
Several inputs can change the final size even when the market idea itself has not changed.
The capital base establishes the amount of account equity being managed. The risk budget defines how much of that capital may be lost on the position under the plan. The loss boundary determines the adverse distance, which becomes part of the risk per unit. Existing positions then determine how much related exposure is already active.
Volatility can influence these inputs indirectly. A wider-moving instrument may require a wider structural boundary, increasing risk per unit and reducing the size that fits a fixed risk budget. The calculation responds to that larger per-unit exposure.
A Practical Position Sizing Sequence
- Define the capital base: identify the account, portfolio sleeve, or risk budget being managed.
- Set the planned risk amount: determine how much capital may be lost if the predefined boundary is reached.
- Measure risk per unit: calculate the adverse exposure carried by one share, contract, lot, or other unit.
- Calculate the base size: divide the planned risk amount by risk per unit.
- Review the account consequence: check concentration, existing exposure, instrument mechanics, and execution assumptions before finalizing the position.
This order keeps the unit count tied to an explicit risk budget. If the boundary, risk amount, or per-unit exposure changes, the size should be calculated again.
Position Sizing vs Related Risk Concepts
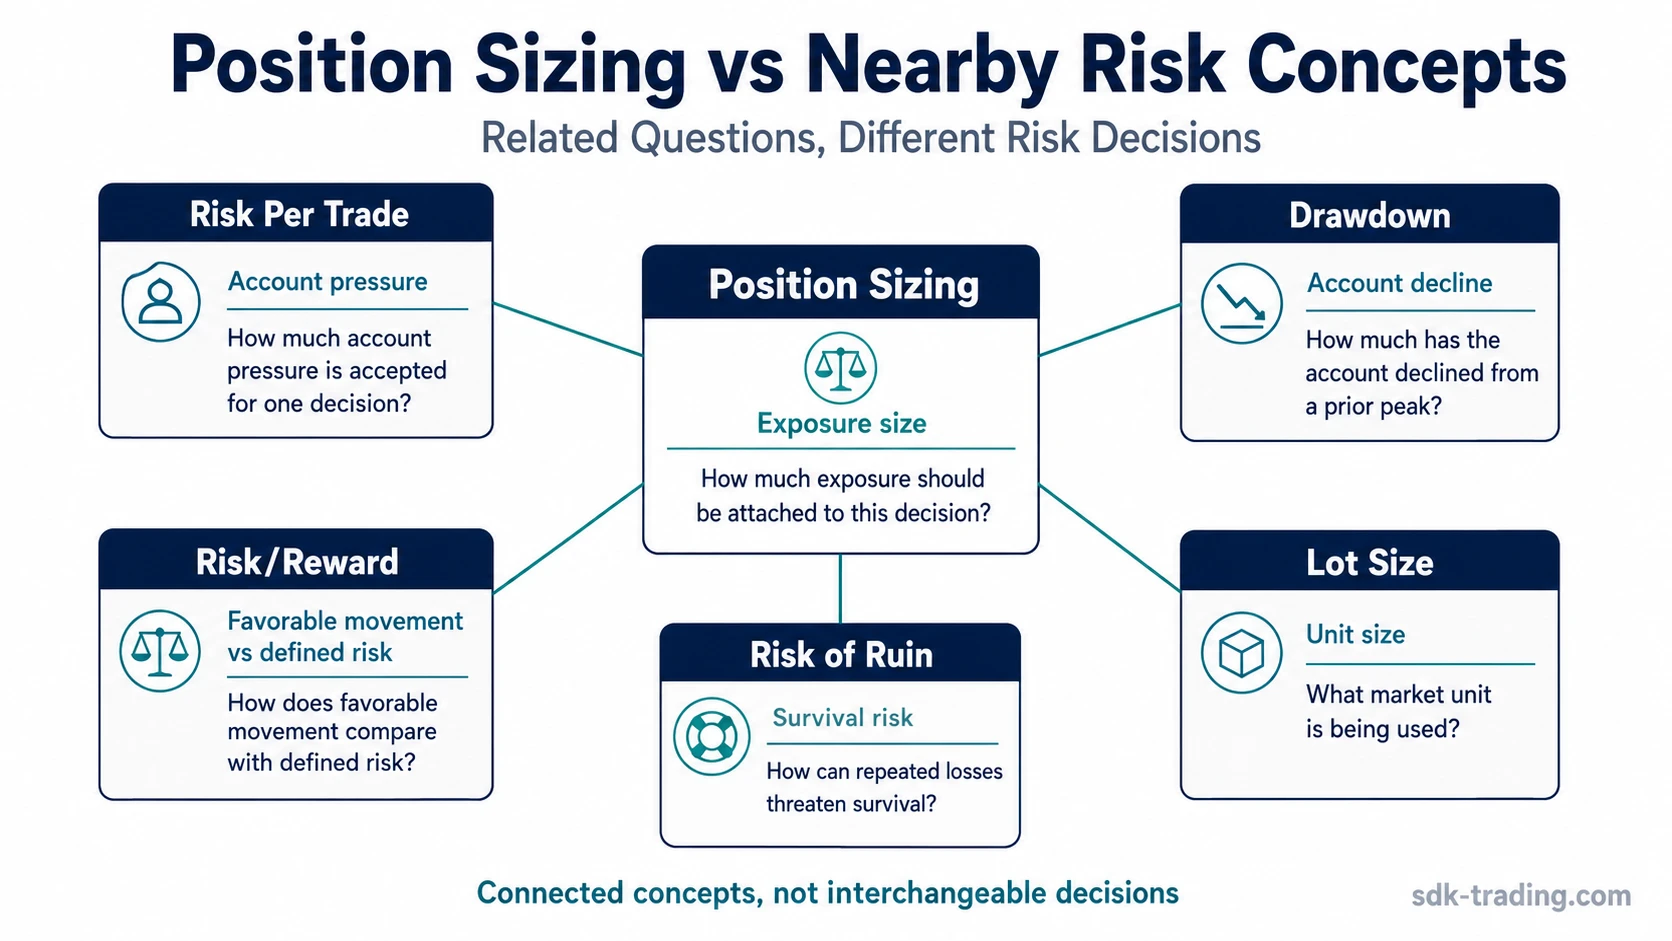
Position sizing interacts with several nearby risk concepts, but each describes a different part of the process.
| Concept | Main question |
|---|---|
| Position sizing | How many units fit the defined risk inputs? |
| Risk per trade | How much account capital is assigned to the potential loss on one decision? |
| Risk/reward ratio | How does planned downside compare with planned upside? |
| Drawdown | How far has the account declined from a prior peak? |
| Risk of ruin | How can repeated losses and exposure threaten account survival? |
| Stop-loss placement | Where is the unfavorable trade boundary placed? |
| Lot size | What standardized unit is used by the instrument or venue? |
Position sizing sits between the risk budget and the actual unit count. The nearby concepts supply other parts of the risk framework, including the location of the loss boundary, the planned payoff relationship, and the account consequence of repeated losses.
A Simple Position Sizing Scenario
A trader evaluates two setups with the same $100 risk budget. The first carries $1 of planned loss per unit, so the base calculation allows 100 units. The second carries $4 of planned loss per unit, reducing the base size to 25 units.
Now assume the second trade is highly correlated with several positions already open in the account. The 25-unit calculation remains mathematically correct for that individual trade, while the portfolio check may still lead to a smaller final position because the new exposure adds to an existing risk concentration.
The change in position size comes from the exposure created by the trade and the account around it. The market thesis can remain unchanged.
Where Position Size Calculators Fit
A position size calculator can automate the arithmetic once the inputs have been defined. For a simple price-based trade, those inputs may include account capital, the planned risk amount or fraction, entry price, stop price, and instrument value per price unit.
The calculator will process whatever values it receives. An unrealistic stop, incomplete contract specification, or ignored portfolio concentration can therefore produce a precise numerical answer from weak inputs.
Calculator boundary: Use the tool for arithmetic. The trader still has to define the risk budget, loss boundary, instrument mechanics, and wider account exposure.
Position Sizing Across Different Markets
The same risk logic can be applied across markets, while the exposure unit changes.
Stocks commonly use shares. Forex positions may be expressed in units or lots. Futures use contracts with specific multipliers and point values. Options can introduce premium, contract multipliers, spread structure, expiration, assignment, and changing sensitivity to the underlying asset.
Ten shares, ten futures contracts, and ten forex lots therefore carry very different economic exposure. Position sizing has to translate the instrument’s actual risk mechanics into the account-level loss estimate.
Instrument limitation: Entry-to-stop distance is easiest to use when per-unit loss is directly measurable. More complex instruments may require additional assumptions about leverage, contract value, premium behavior, liquidity, or execution.
Common Position Sizing Mistakes
| Mistake | What changes |
|---|---|
| Choosing the unit count before calculating risk | The account consequence is discovered only after the exposure has already been selected. |
| Using the same size across different stop distances | The planned capital loss changes as risk per unit changes. |
| Moving the stop to justify a larger position | The trade boundary begins serving the desired unit count instead of the original trade logic. |
| Ignoring related positions | Several individually acceptable trades can create a large shared exposure. |
| Relying only on a calculator | Incomplete inputs can still generate a mathematically precise result. |
| Increasing size because conviction is high | Account exposure rises even though the underlying risk budget has not changed. |
When Position Sizing Is Controlled
A controlled sizing decision can be traced back to specific inputs. The trader can identify the risk budget, the loss carried by one unit, the loss boundary used in the calculation, and the account consequence of adding the new exposure.
When the explanation for size is mainly confidence, desired profit, recent wins or losses, or the maximum amount the account can buy, the unit count has become disconnected from the original risk calculation.
Position Sizing in Trading FAQ
What is position sizing in trading?
Position sizing in trading is the process of converting a planned risk amount and the risk carried by each unit into the number of shares, contracts, lots, or other units held.
Is position sizing the same as risk per trade?
No. Risk per trade defines the amount of account capital assigned to the potential loss on one decision. Position sizing uses that risk amount together with risk per unit to calculate the position quantity.
Is a position size calculator enough?
A calculator can handle the arithmetic, but its result depends on the quality of the inputs. The risk amount, loss boundary, instrument mechanics, and existing exposure still need to be defined correctly.
Does position sizing improve trade quality?
Position sizing controls the amount of exposure attached to a trade. Market direction, setup quality, and the probability of success come from other parts of the analysis.
How is position sizing related to drawdown?
Position size affects how much damage each loss can create in the account. Drawdown measures the decline from a prior account peak after those gains and losses have occurred.